Figures & data
Table 1 Treatment Groups in the Experiment
Table 2 Parameters of the Atmospheric Plasma Generator
Figure 1 FE-SEM images of the titanium samples in: (A) the control group; (B) Group N containing only a nitride layer; (C) Group NA subjected to both nitriding and anodic oxidation; and (D) Group NAG subjected to nitriding, anodic oxidation, and graphene oxide deposition (10,000x FE-SEM mode). (E) the control group; (F) Group N containing only a nitride layer; (G) Group NA subjected to both nitriding and anodic oxidation; and (H) Group NAG subjected to nitriding, anodic oxidation, and graphene oxide deposition (100,000x FE-SEM mode).
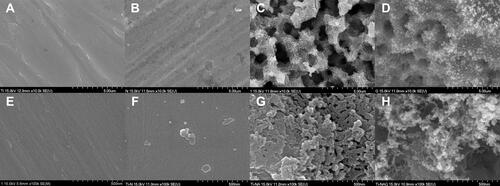
Figure 2 Raman spectrum of the graphene oxide layer generated on the titanium surface confirming that the deposited carbon film was composed of graphene oxide.
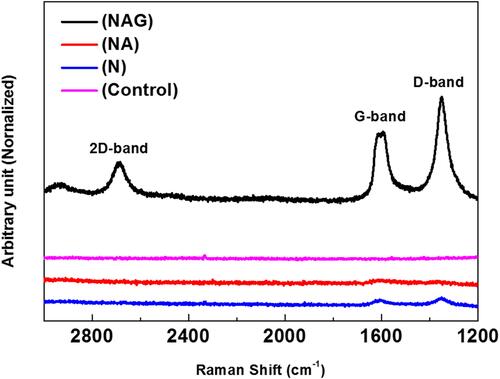
Figure 3 XPS spectra of the titanium samples in: (A) the control group; (B) Group N; (C) Group NA; and (D) Group NAG.
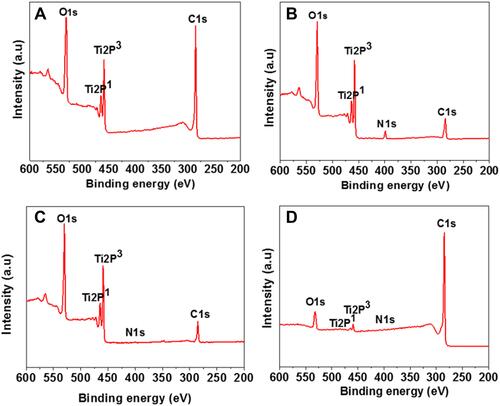
Figure 4 Three-dimensional surface morphology and roughness of the titanium samples in: (A) the control group; (B) Group N; (C) Group NA; and (D) Group NAG.
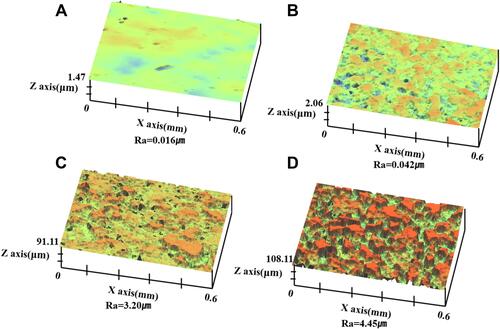
Figure 5 Water contact angle measurements for the titanium samples in: (A) the control group; (B) Group N; (C) Group NA; and (D) Group NAG.
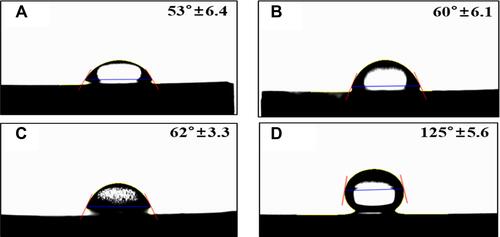
Figure 6 Results of a one-way ANOVA test to analyze the adhesion of Streptococcus mutans (S.M) and Porphyromonas gingivalis (P.G) to the titanium samples in the control group and groups N, NA, and NAG. **Marginally significant at p < 0.001.
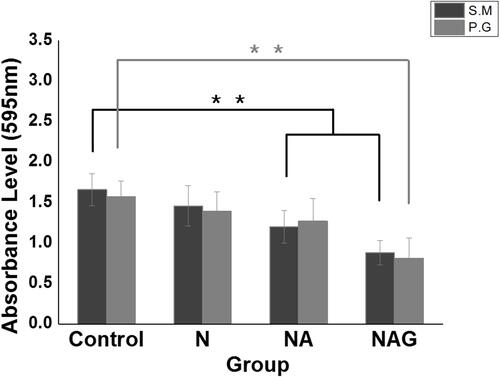
Figure 7 Results of one-way ANOVA tests for the WST assays conducted on cells cultured for either 24 h or 5 days on the titanium samples in the control group and groups N, NA, and NAG. **Marginally significant at p < 0.001.
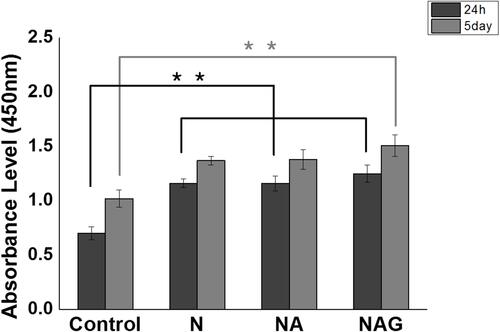
Figure 8 Fluorescent staining images of cells cultured for either 24 h (64× confocal laser scanning microscope mode). (A) the control group; (B) Group N; (C) Group NA; and (D) Group NAG. Fluorescent staining images of cells cultured for either 5 days (128× confocal laser scanning microscope mode). (E) the control group; (F) Group N; (G) Group NA; and (H) Group NAG. Green fluorescence indicates viable cells and red fluorescence indicates dead cells.
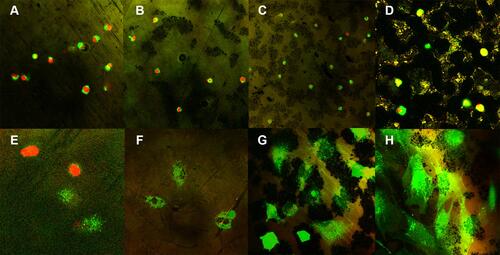
Figure 9 Results of a one-way ANOVA test for cells cultured for 7 days on titanium samples in the control group and groups N, NA, and NAG and measured with an ALP assay. *Marginally significant at p < 0.05, **Marginally significant at p < 0.001.
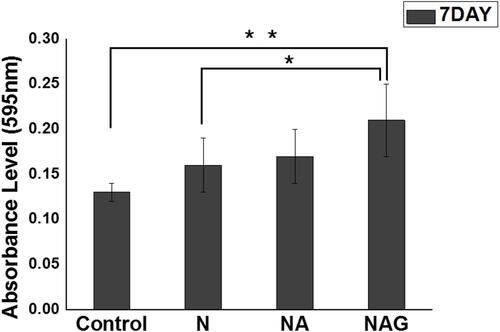
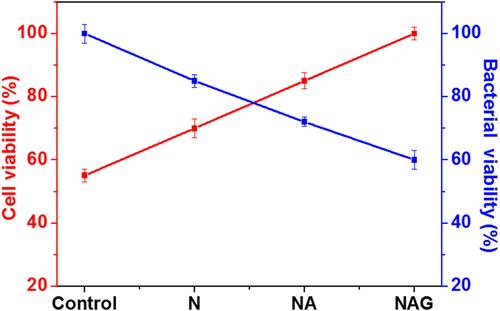
Figure 10 Comparison of the cell viabilities and antibacterial effects among the titanium control group and groups N, NA, and NAG.