Figures & data
Figure 1 Synthesis of MAEHA copolymer.
Note: Synthesis of MAEHA copolymer using methacrylic acid and 2-ethyl hexyl acrylate as monomers by microemulsion polymerization using KPS as a radical initiator and SDS as the surfactant.
Abbreviations: MAEHA, methacrylic acid-co-2-ethyl hexyl acrylate; KPS, potassium persulfate; SDS, sodium dodecyl sulfate.
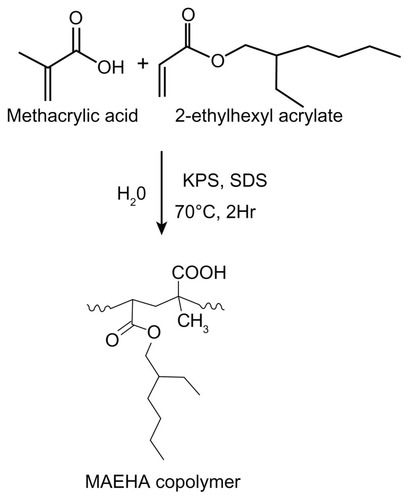
Figure 2 Schematic representation of the loading of 5-FU inside the MAEHA polymer matrix.
Note: The loading of the 5-FU drug inside the polymer matrix of MAEHA is hypothesized as shown.
Abbreviations: 5-FU, 5-Fluorouracil; MAEHA, methacrylic acid-co-2-ethyl hexyl acrylate.
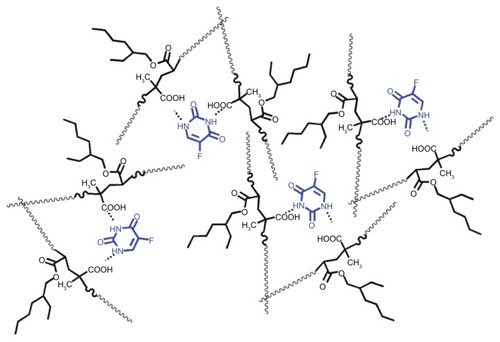
Figure 3 FTIR spectra of MAEHA copolymer.
Note: FTIR spectra of MAEHA copolymer was recorded using potassium bromide pellets. Peak a: 1731 cm−1 (ester), 1701 cm−1 (acid); peak b: 3445 cm−1 (−OH); peak c: 1189 cm−1 and 1269 cm−1 (ester); peak d: 2961−2931 cm−1 (ester).
Abbreviations: FTIR, Fourier transform infrared spectroscopy; MAEHA, methacrylic acid-co-2-ethyl hexyl acrylate.
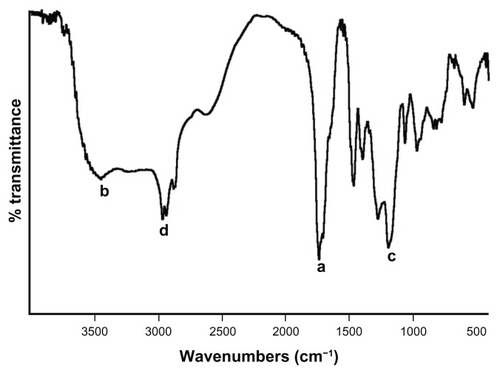
Figure 4 1H NMR spectra of MAEHA copolymer.
Notes: The presence of methyl (−CH3), methylenic (−CH2-), and tertiary methyl groups were also confirmed by the spectral data (peaks A, B, and C). The NMR spectral peak at 4.0 δ shows the presence of a methylenic group adjacent to the carboxyl group of EHA (peak D). 1H NMR spectra of methacrylic acid-co-2-ethyl hexyl acrylate (MAEHA) copolymer was recorded using acetone as the solvent.
Abbreviations: 1H NMR, proton nuclear magnetic resonance spectroscopy; MAEHA, methacrylic acid-co-2-ethyl hexyl acrylate.
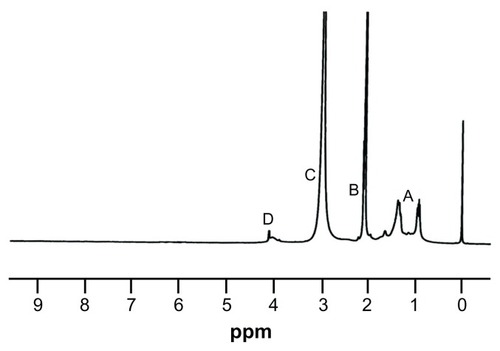
Figure 5 DSC thermogram of MAEHA copolymer.
Note: DSC of MAEHA copolymer was recorded under nitrogen flow at a scanning rate of 10°C min−1.
Abbreviations: DSC, differential scanning calorimetry; MAEHA, methacrylic acid-co-2-ethyl hexyl acrylate.
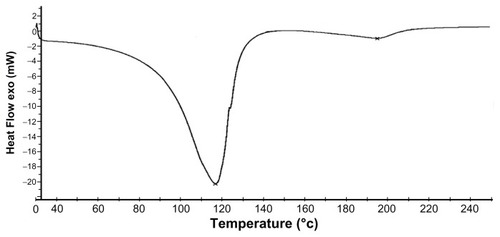
Figure 6 TEM image of MAEHA nanogels.
Notes: For TEM, the sample of MAEHA nanogel suspension in Milli-Q® water was dropped onto formvar-coated copper grids without being negatively stained. Measurements were taken only after the sample had completely dried.
Abbreviations: TEM, transmission electron microscopy; MAEHA, methacrylic acid-co-2-ethyl hexyl acrylate.

Figure 7 AFM image of MAEHA nanogels. (A and C) Phase images; (B and D) amplitude images.
Notes: For AFM, the sample of 1 μL of MAEHA nanogel suspension was dropped onto freshly cleaved mica surface and washed with 50 μL of Milli-Q® water. Measurements were taken only after the sample had completely dried.
Abbreviations: AFM, atomic force microscopy; MAEHA, methacrylic acid-co-2-ethyl hexyl acrylate.
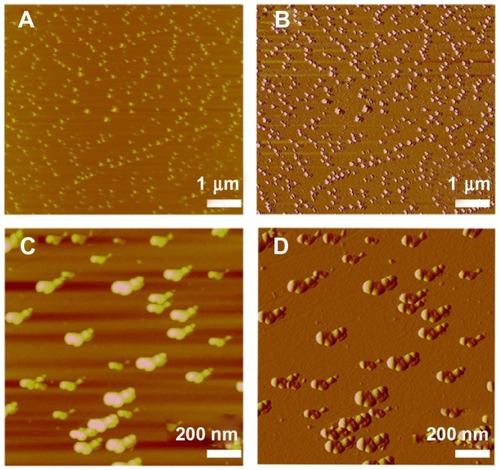
Figure 8 Dynamic light scattering curve showing the particle size of the methacrylic acid-co-2-ethyl hexyl acrylate nanogels.
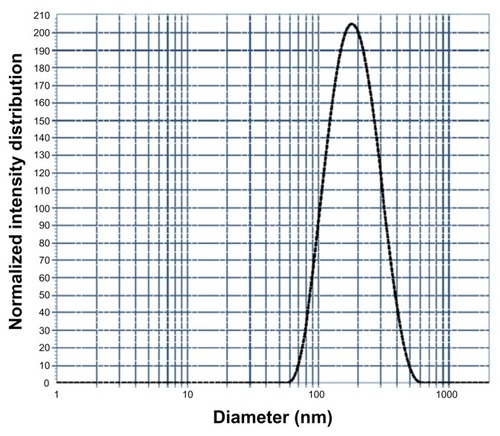
Figure 9 In vitro drug-release profile from the MAEHA nanogels.
Notes: Release pattern of the drug 5-FU from MAEHA nanogels in phosphate-buffered saline at pH 7.8, pH 7.0, and pH 2.0 at 37°C. All measurements were done in triplicate. The results are expressed as arithmetic mean ± standard error of the mean.
Abbreviations: MAEHA, methacrylic acid-co-2-ethyl hexyl acrylate; 5-FU, 5-Fluorouracil.
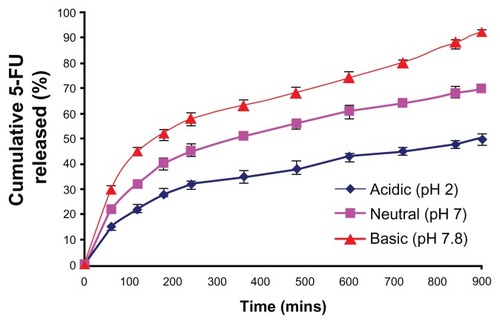
Figure 10 MTT analysis of MAEHA nanogels with 5-FU on HCT-116 cells at (A) 24, (B) 48, and (C) 72 hours on incubation at the concentrations indicated.
Abbreviations: MTT, 3-(4, 5-dimethylthiazol-2-yl)-2,5-diphenyltetrazolium bromide; MAEHA, methacrylic acid-co-2-ethyl hexyl acrylate; 5-FU, 5-Fluorouracil; HCT, human colon tumor.
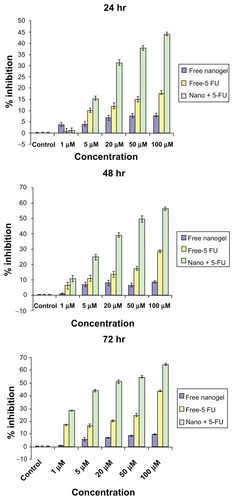
Figure 11 Cellular uptake studies of MAEHA nanogels.
Notes: Top row: confocal images of HCT-116 cells after 4 hours incubation with rhodamine-entrapped MAEHA nanogels: bright field, rhodamine, Hoescht stain, merged image. Bottom row: confocal images of HCT-116 cells after 4 hours incubation with blank MAEHA nanogels: bright field, rhodamine, Hoescht stain, merged image.
Abbreviations: MAEHA, methacrylic acid-co-2-ethyl hexyl acrylate; HCT, human colon tumor.
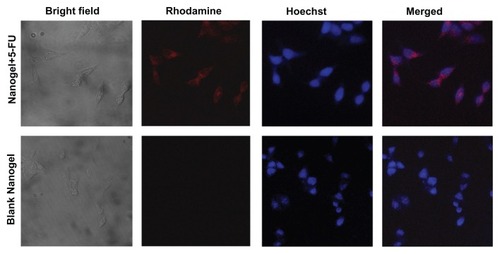
Figure 12 Immunoblot analysis and densitometry graph showing PARP. (A) Comparison of PARP cleavage induced by 25, 50, and 80 μM of MAEHA nanogels with 5-FU in HCT-116 cells after incubation for 24 hours. (B) Densitometry graph showing the intensity of the bands.
Notes: All measurements were done in triplicate. Results are expressed as arithmetic mean ± standard error of the mean.
Abbreviations: PARP, poly (ADP-ribose) polymerase; 5-FU, 5-Fluorouracil; MAEHA, methacrylic acid-co-2-ethyl hexyl acrylate.
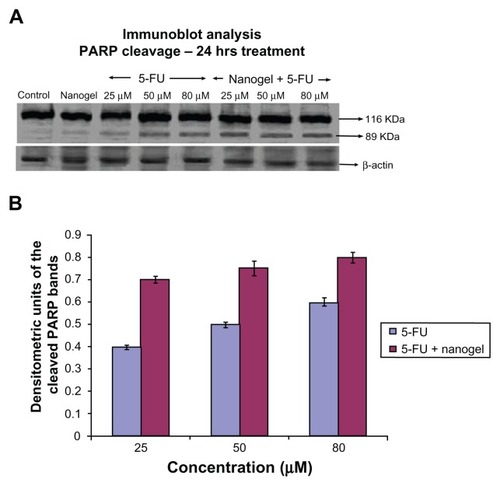
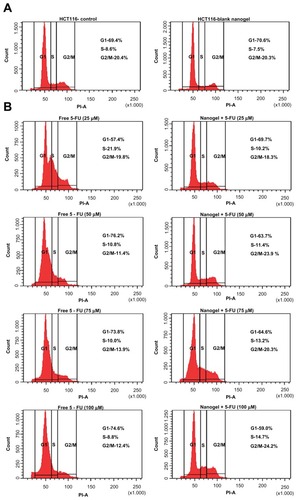
Figure 13 Fluorescein-activated cell-sorting analysis. (A) Cell-cycle analysis of HCT-116 cells: (left) control and (right) blank nanogels. (B) Cell-cycle analysis of HCT-116 cells of free 5-FU and MAEHA nanogels with 5-FU in concentrations 25, 50, 75, and 100 μM.
Abbreviations: HCT, human colon tumor; 5-FU, 5-Fluorouracil; MAEHA, methacrylic acid-co-2-ethyl hexyl acrylate.