Figures & data
Figure 1 Ultraviolet-visible absorption spectra of GNP, MB, and GNP–MB conjugate.
Notes: GNP has signature spectra at 534 nm due to surface plasmon resonance. MB shows absorption peaks at 662 nm and 613 nm. With the increase of MB concentration in constant concentration of GNP (0.2 mg/mL), absorption peaks of GNP successively vanished at 534 nm, and new enhanced absorption peaks formed at 662 nm and 613 nm. Coloration pattern is shown in inset. Test tubes 1, 2, 3, and 4 show MB of 2.50, 5.00, 10.00 and 20.00 μg/mL concentrations, respectively. Test tubes 5 and 6 show GNP (0.2 mg/mL) and GNP–MB (20.00 μg/mL MB), respectively.
Abbreviations: GNP, gold nanoparticle; MB, methylene blue.
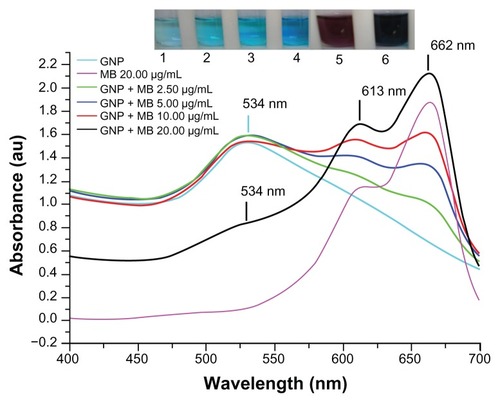
Figure 2 X-ray powder diffraction pattern by Cu Kα radiation (λ = 1.54060 Å) in 2θ ranging from 30° to 80°.
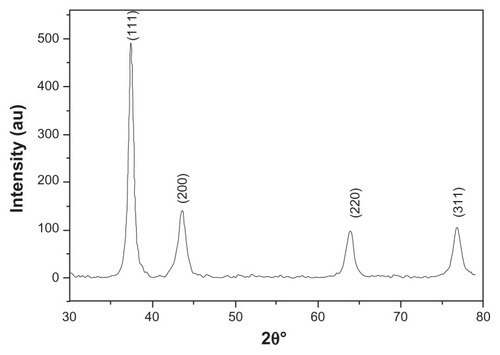
Figure 3 (A–C) Transmission electron microscopy images of GNP and GNP–MB (20 μg/mL; MB) conjugate. (C) Synthesized and clearly spherical colloidal GNPs with average size 21 ± 2.5 nm. (B) MB-conjugated GNPs and coating of MB around GNP are shown by black arrows. (A) The 2.52-nm thickness of MB coating around GNP. Photon cross-correlation spectra of GNP and GNP–MB (20 μg/mL; MB) conjugate are shown in (D and E) respectively. (D) Hydrodynamic mean diameter of GNP around 22.4 nm. (E) Hydrodynamic mean diameter of GNP–MB conjugate around 26.5 nm.
Abbreviations: GNP, gold nanoparticle; MB, methylene blue.
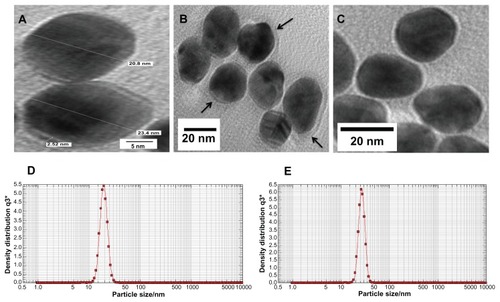
Figure 4 Percent transmittance Fourier transform infrared spectroscopy spectra of MB (20 μg/mL) and GNP–MB (20 μg/mL; MB) conjugate.
Notes: GNPs in GNP–MB conjugate show characteristic transmittance peak at 654 cm−1. GNP–MB conjugate shows the prominent peak difference as compared to MB, shown by black arrows.
Abbreviations: GNP, gold nanoparticle; MB, methylene blue.
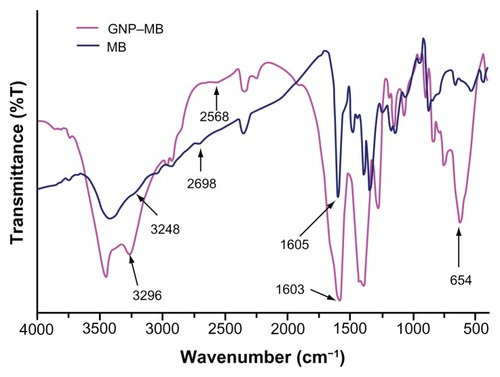
Figure 5 Fluorescence emission spectra of GNP (0.2 mg/mL), MB (20 μg/mL), and GNP–MB (20 μg/mL; MB) conjugate after excitation at 660 nm.
Notes: In the presence of GNP (0.2 mg/mL), the fluorescence emission peak of MB quenches at 684 nm. In inset, GNP shows a maximum fluorescent emission peak at 665 nm.
Abbreviations: GNP, gold nanoparticle; MB, methylene blue.
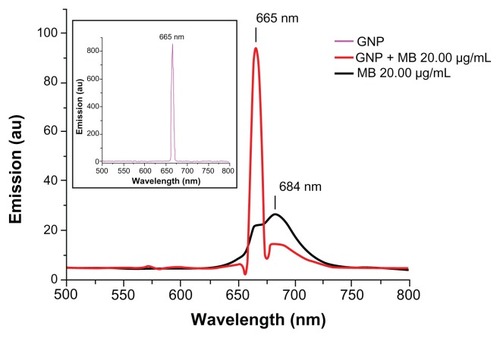
Figure 6 Crystal violet biofilm reduction assay bar plot represents the reduced biofilm optical density measurement at 595 nm.
Notes: Here, GNP (0.2 mg/mL) optical density shows the negligible inhibition of Candida biofilm as compared to control. With the increment of MB concentration in GNB-MB conjugate (1.75 μg/mL to 20 μg/mL; MB), biofilm or optical density of biofilm significantly decreases in GNP–MB-treated biofilm, in comparision to MB-treated biofilm.
Abbreviations: GNP, gold nanoparticle; MB, methylene blue.
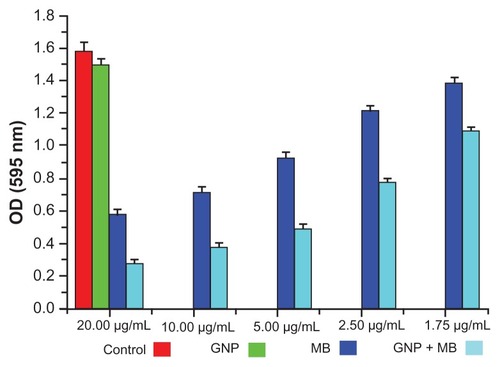
Figure 7 Bar plot represents the XTT biofilm reduction assay at 490 nm.
Notes: Here, GNP (0.2 mg/mL)-treated and control biofilm show a negligible difference in optical density. With increments in MB and its concentration in GNP–MB conjugate (1.75 μg/mL to 20 μg/mL; MB), biofilm or optical density of biofilm significantly decreases in GNP–MB-treated biofilm as compared to MB-treated biofilm.
Abbreviations: GNP, gold nanoparticle; MB, methylene blue.
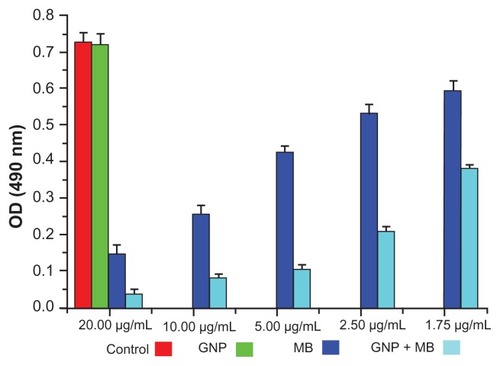
Figure 8 (a–t) Morphological, cytological, and cytometabolic effects of GNP–MB (20 μg/mL; MB) conjugate on Candida biofilm. Here, morphology of Candida biofilm showed by scanning electron micrographs (a–d) 12-hour-grown biofilm; (e–h) 24-hour-grown biofilm); (b and f) GNP-treated Candida biofilm; (a and e) control. (c, d, g and h) Effects of GNP–MB conjugate on Candida biofilm. (j–l) Cytological effects of GNP–MB conjugate in 12-hour-grown Candida cells represented by transmission electron micrograph; (i) control; (M–T) Candida cytological perturbations in 12-hour-grown Candida cells viewed by confocal scanning micrograph; (o, p, s and t) GNP–MB treated; (n and r) GNP-treated; (m and q) control. Bars in (a–T) are 2 μM and 1 μM, respectively.
Abbreviations: GNP, gold nanoparticle; MB, methylene blue.
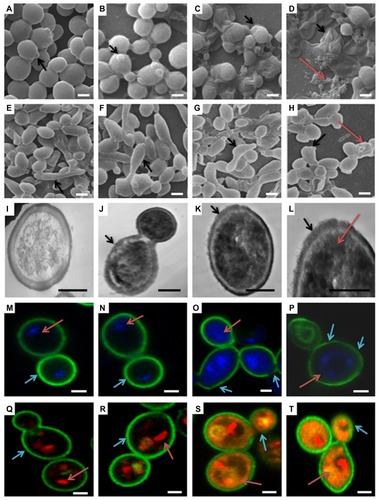
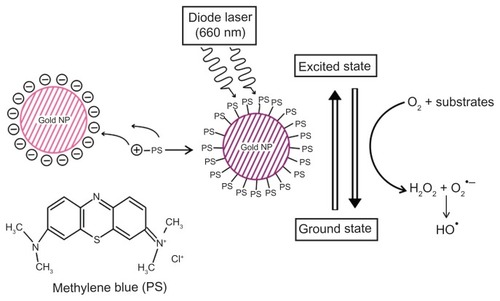
Figure 9 Schematic overview of conjugation of photosensitizer MB with GNP.
Notes: Specific 660-nm wavelength of diode laser transits MB of GNP–MB conjugate to an excited state. Nonradiative energy decay by GNP of MB causes the transition to ground state, which results in the formation of hydroxyl free radicals in the presence of molecular oxygen and substrates around the vicinity of the conjugate (type I phototoxicity).
Abbreviations: GNP, gold nanoparticle; MB, methylene blue.