
Figures & data
Figure 1 XRD patterns of IONPs (A), CS-IONPs (B), and Chloramb-CS-IONPs (C).
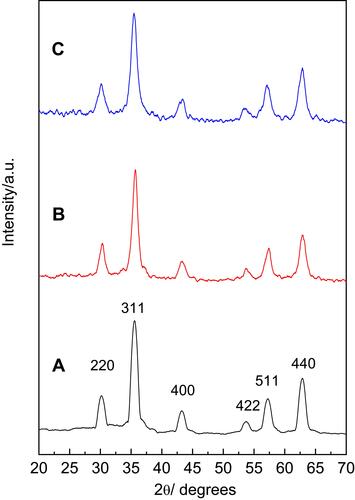
Figure 2 FTIR spectrum of Chloramb (A), IONPs (B), CS-IONPs (C), and Chloramb-CS-IONPs (D).
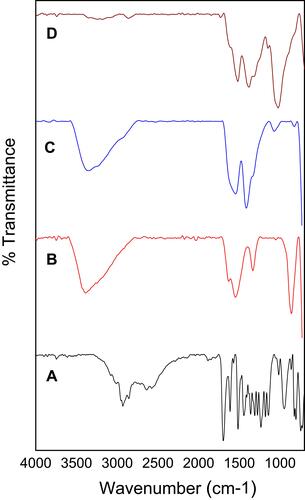
Figure 3 Molecular structure model of chloramb intercalated with IONPs.
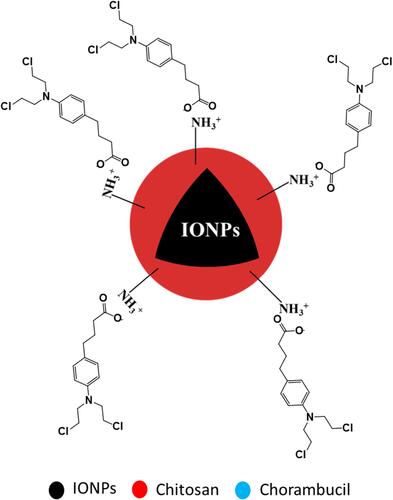
Figure 4 Thermal gravimetric analysis curves of Chloramb (A), IONPs (B), CS-IONPs (C) and Chloramb-CS-IONPs (D).
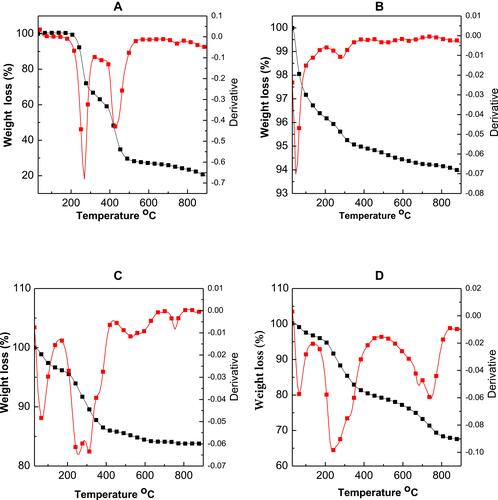
Figure 5 TEM image of CS-IONPs (A) and Chloramb-CS-IONPs (B).
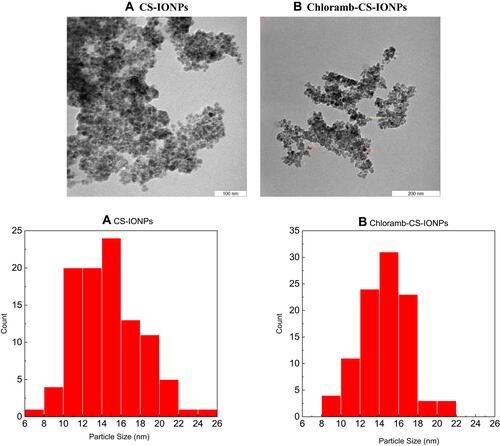
Figure 6 Scanning Electron Microscopy (SEM) of CS-IONPs (A) and Chloramb-CS IONPs (B).
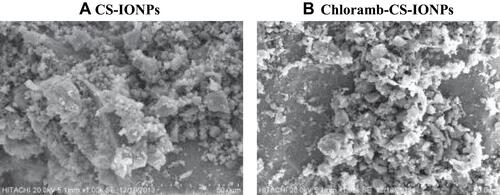
Figure 7 Magnetization curves of IONPs, CS-IONPs, and chloramb-CS-IONPs recorded at room temperature.
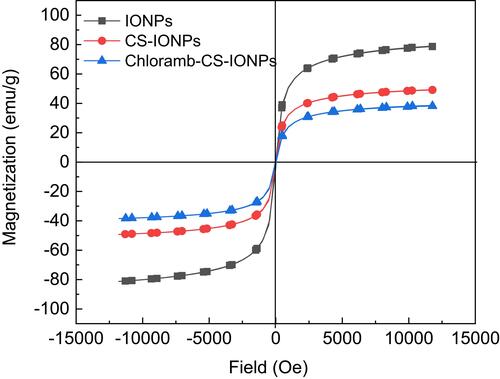
Figure 8 Release profiles of Chloramb from the Chloramb-CS-IONPs nanocomposite into phosphate buffered solution at pH 7.4.
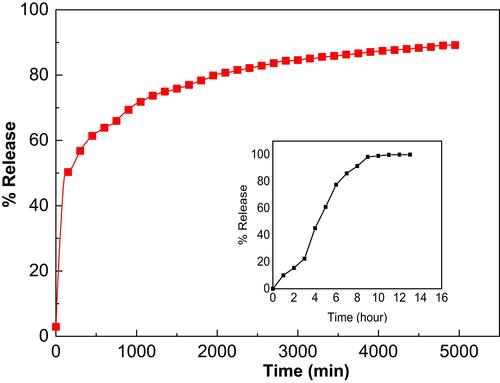
Figure 9 Fitting the data of Chloramb release from Chloramb-CS-IONPs nanocomposite into different kinetics models (A–F).
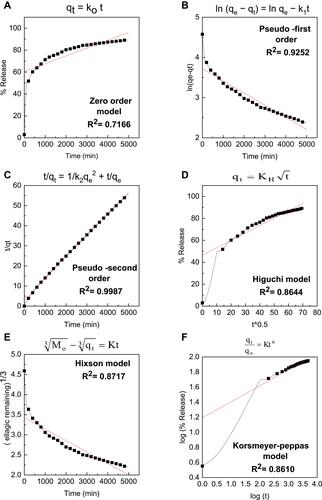
Figure 10 Cytotoxicity assay IONPs, CS-IONPs, Chloramb and Chloramb-CS-IONPs nanocomposite against normal fibroblast, 3T3 cells (A) and cancer WEHI cells (B).
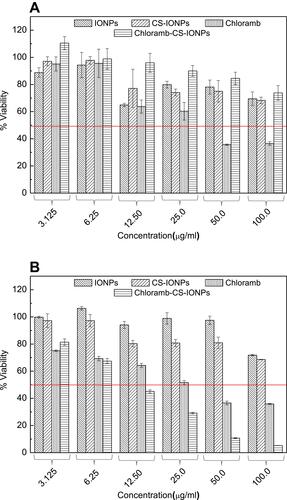
Table 1 The IC50 Value for IONPs, CS-IONPs, Chloramb and Chloramb-CS-IONPs Nanocomposite Tested on 3T3 and WEHL Cell Lines