Figures & data
Figure 1 (A) Midline laparotomy. Retraction of the spleen and stomach. Celiac trunk (thick black arrow), hepatic artery (thin white arrow), and gastroduodenal artery (white arrowhead). (B) Exposure of the celiak trunk. Direct puncture of the artery with a 30G needle. Celiac trunk (thick black arrow) and hepatic artery (thin white arrow). The gastroduodenal artery appears clamped by a removable surgical staple (white arrowhead).
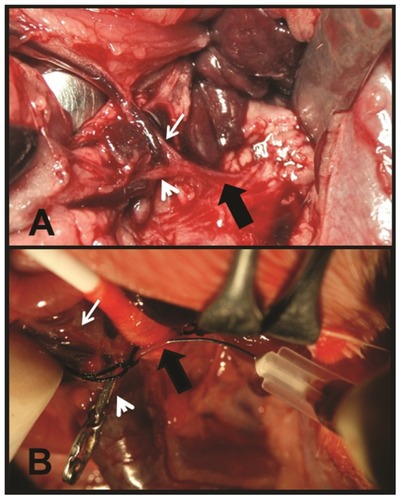
Table 1 Results of the measurements in the two groups of rats
Figure 2 MRIs of two different animals. Axial STIR, DP*, and T2*-weighted sequences at the same slice position. ROIs are located for obtaining measurements of the SI in (1) tumor implants, (2) liver, and (3) paravertebral muscles. (A) MRI of a CG rat. On the STIR image, the liver and the paravertebral muscles are seen to have a similar SI, while the tumor tissue appears hyperintense (white circle). On the DP* image, the neoplastic tissue is not clearly seen. On the T2* image, the tumor appears slightly hyperintense compared to healthy liver tissue. (B) MRI of an IG rat. On the STIR image, the liver and the paravertebral muscles are seen to have a similar SI, while the tumor tissue appears hyperintense (white circle). On the DP* and T2* images, it can be seen that there is a substantial decrease in the SI from healthy liver and, especially, from tumor tissue, due to the presence of magnetic nanoparticles.
Abbreviations: MRI, magnetic resonance imaging; ROI, region of interest; SI, signal intensity; CG, control group; IG, infused group.
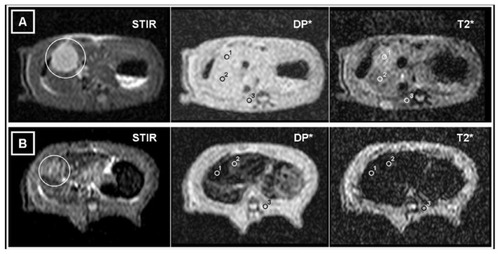
Figure 3 Scatter plot of the iron concentration values quantified using ICP-MS against the SI ratio from healthy liver and tumor tissues, calculated from DP* and T2*-weighted images. Control rats, (A) DP* and (B) T2*. In DP* sequence images, the values obtained are similar, but in the case of T2*-weighted sequences, significantly lower values for the healthy liver can be seen. Rats infused with magnetic fluids, (C) DP* and (D) T2*. In both the DP*- and T2*-weighted images, the SIr in the tumors tends to progressively decrease with increasing iron in the tumor tissue. In the healthy liver tissue, the trend is not as clear, which is probably related to differences in the endogenous and exogenous [Fe], which affects the measurement of the metal in the tissue.
Abbreviations: ICP-MS, inductively coupled plasma-mass spectrometry; SI, signal intensity; Slr, signal intensity ratio; [Fe], iron concentration.
![Figure 3 Scatter plot of the iron concentration values quantified using ICP-MS against the SI ratio from healthy liver and tumor tissues, calculated from DP* and T2*-weighted images. Control rats, (A) DP* and (B) T2*. In DP* sequence images, the values obtained are similar, but in the case of T2*-weighted sequences, significantly lower values for the healthy liver can be seen. Rats infused with magnetic fluids, (C) DP* and (D) T2*. In both the DP*- and T2*-weighted images, the SIr in the tumors tends to progressively decrease with increasing iron in the tumor tissue. In the healthy liver tissue, the trend is not as clear, which is probably related to differences in the endogenous and exogenous [Fe], which affects the measurement of the metal in the tissue.Abbreviations: ICP-MS, inductively coupled plasma-mass spectrometry; SI, signal intensity; Slr, signal intensity ratio; [Fe], iron concentration.](/cms/asset/6be595f4-da70-440d-b407-9181272260c5/dijn_a_31302_f0003_c.jpg)
Figure 4 Bland–Altman plot. The relationship between pairs of values of tissue iron concentration in μmol·g−1 as assessed using MRI and ICP-MS. On the x-axis, the average of the values obtained using the two techniques: (MRI+ICP−MS)/2; on the y-axis, the difference between the results obtained: MRI−ICP-MS. Results in CG rats: (A) liver and (B) tumors. There is excellent agreement between the two measurement techniques: in both A and B, the means of the differences between the results obtained by the two techniques are similar. Results in IG rats: (C) liver and (D) tumors. There is notable disagreement, attributable to the high values estimated by MRI.
Abbreviations: ICP-MS, inductively coupled plasma-mass spectrometry; CG, control group; IG, infused group.
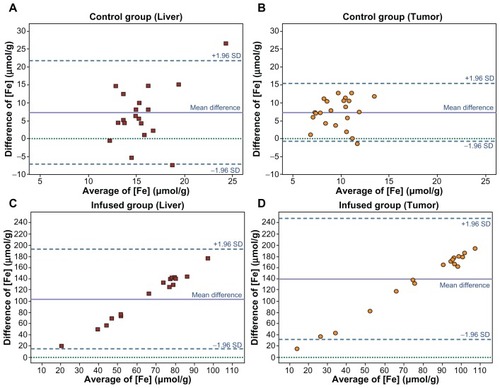
Figure 5 Scatter plot of the tumor volume of the infused rats against [Fe] in μg·g−1, determined using ICP-MS.
Note: The measured iron tissue concentration is higher in the smallest lesions.
![Figure 5 Scatter plot of the tumor volume of the infused rats against [Fe] in μg·g−1, determined using ICP-MS.Note: The measured iron tissue concentration is higher in the smallest lesions.](/cms/asset/9febf8c7-b50b-4943-90a3-781a2cff0fd3/dijn_a_31302_f0005_c.jpg)
Figure 6 Box plot, graphical representation of the quantification of the metal by ICP-MS, in liver and tumor tissues, in the two groups of animals.
Note: A significantly higher [Fe] can be observed in the tumors of IG animals.
Abbreviations: ICP-MS, inductively coupled plasma-mass spectrometry; IG, infused group.
![Figure 6 Box plot, graphical representation of the quantification of the metal by ICP-MS, in liver and tumor tissues, in the two groups of animals.Note: A significantly higher [Fe] can be observed in the tumors of IG animals.Abbreviations: ICP-MS, inductively coupled plasma-mass spectrometry; IG, infused group.](/cms/asset/7fe536c5-bb53-47dc-8adc-47bc89c69d22/dijn_a_31302_f0006_c.jpg)
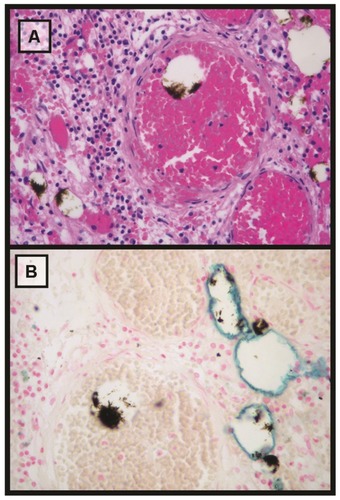
Figure 7 Microscopic analysis (25×) of tumor tissue stained with hematoxylin-eosin and Perls’ Prussian blue. (A) Hematoxylin-eosin stain. Scattered brown deposits of magnetic fluid within vascular structures can be observed. (B) Perls’ Prussian blue. The iron in the deposits of the magnetic fluids does not appear stained, probably due to the intense aggregation. Moreover, non-aggregated iron nanoparticles can be observed as a blue line over the inner edge of the vascular structures.