Figures & data
Figure 1 Characterization data for mAuNPs. Transmission electron micrographs and size distributions of the as-synthesized cAuNPs (A, B) and mAuNPs (C, D), (E) Hydrodynamic diameters and Zeta potentials of cAuNPs and mAuNPs measured with dynamic light scattering (DLS). Note: hydrodynamic diameter and Zeta potential measurements are presented in the supporting information.
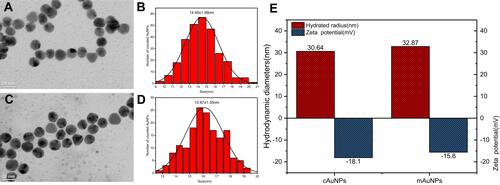
Figure 2 Uptake and distribution of mAuNPs in cells. (A) Photographs taken under dark field microscope for B16-F10 cells cultured with or without mAuNPs for 24h, The cell nuclei were dyed with Hoechst 33342. The yellow arrow shows the autofluorescence of mAuNPs observed in the dark-field microscope. The scale bars represent 10μm. (B) Uptake of mAuNPs by B16-F10 cells at various co-culture concentrations. (C) Transmission electron micrographs of B16-F10 cells cultured with and without mAuNPs. The scale bars (left and right) represent 5μm and 500 nm, respectively.
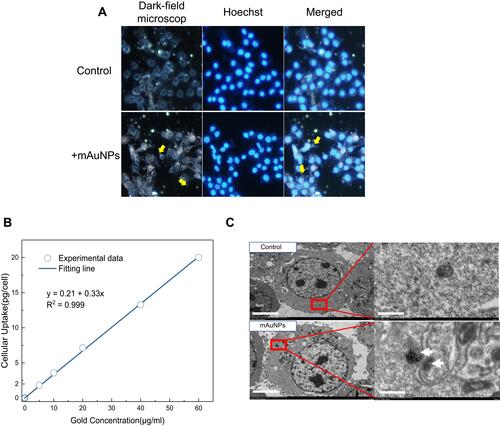
Table 1 Radiobiological Parameters for B16-F10 Cells Irradiated with Carbon Ions (50 μm/keV) in the Presence of mAuNPs
Figure 3 Cell viability of gold nanoparticles and the radiation enhancement in cells. (A) Viability of B16-F10 cells in the presence of mAuNPs at various concentrations. (B) Survival curves of B16-F10 cells with or without mAuNPs in co-culture (mAuNPs concentration of 6 μg/mL) after carbon ion irradiation. The survival curve of B16-F10 cells exposed to X-rays is shown in order to calculate the RBE values under the conditions of carbon ion irradiation with and without mAuNPs.
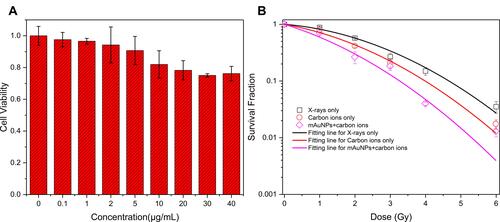
Figure 4 Effects of AuNPs on tumor size and survival in mice. (A) Tumor growth rates of the mice in the different groups; (B) Survival of the tumor-bearing mice in the different groups (*, p<0.05; **, p<0.01).
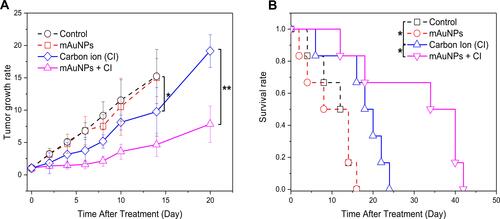
Figure 5 Mouse tumor tissue sections and Tunel experiment. (A) Images of tumor tissue sections stained with HE for the mice in the different groups. Tumor tissue showing obvious necrosis (yellow arrow) 24-h post-irradiation, with the extent of necrotic tissue increasing significantly following the addition of mAuNPs. The scale bars represent 100 μm; (B) Apoptotic cells in tumor tissues detected with the Tunel method 24 h after treatment. The scale bars represent 50 μm; (C) Quantitative analysis of apoptosis. The number of apoptotic cells in the tumor tissues was calculated by averaging the number of positive Tunel signals from eight fields with highest density of Tunel signals in each section. (**, p<0.01).
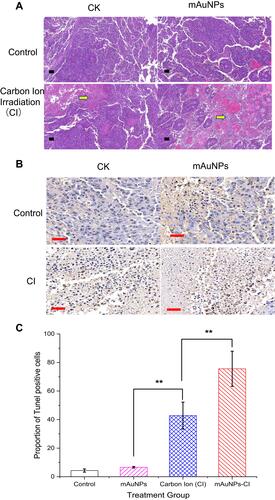
Figure 6 Immunohistochemistry images and analysis results. (A) Photographs of immunohistochemistry. DAB color development, brown-yellow staining is positive cells. The scale bars represent 50 μm; (B) The ratio of Bax expression to Bcl2 expression; (C) Expression analysis of active caspase 3. (**, p<0.01).
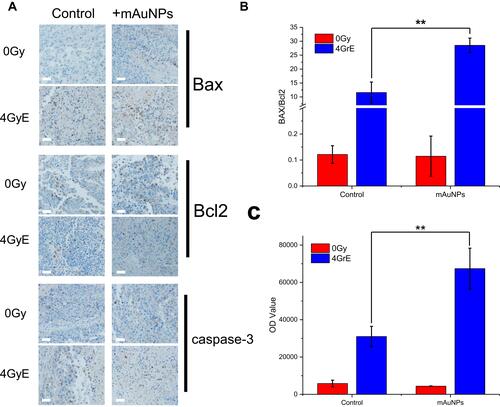
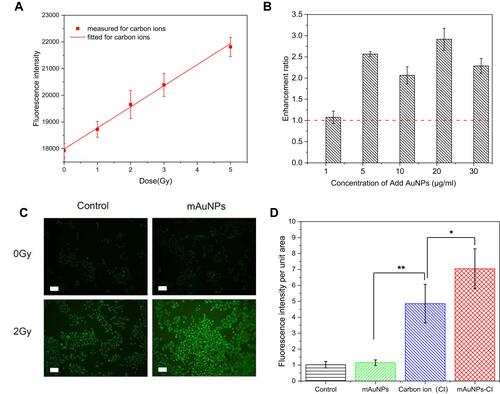
Figure 7 Enhanced radiation in solution and increased production of intracellular ROS. (A) Fluorescence intensity varies dependent on the dose of carbon ion irradiation; (B) Enhancement ratio of hydroxyl radical production in aqueous solution of AuNPs at different concentrations under carbon ion irradiation; (C) Fluorescent images of ROS with DCHF-DA in B16-F10 cells after irradiation at 2 Gy in the presence of mAuNPs. The scale bars represent 50 μm; (D) The fluorescence intensity per unit area in B16-F10 cells after irradiation. (*, p<0.05, **, p<0.01).