Figures & data
Figure 1 Rational structure design of THCMA. (A) Two regions involved in the interactions between P-selectin (surface model) and PSGL1 (ribbon model), sLeX moiety (stick model) and sulfated tyrosine Tys48 (stick model). (B) PSI-697 (cyan stick model) and PSI-421 (orange stick model) binding at the PSGL1 Tys48 binding site of P-selectin (surface model). (C) THCMA structurally designed by connecting two pharmacophores of PSI-697 with a linker to produce an amphiphilic molecule for improved solubility (logS) and bioavailability (logP). (D) Molecular interactions and binding energies between P-selectin (ribbon model) and PSI-697 (cyan stick model) and THCMA (wheat stick model), with detailed interactions presented in 2-D. Figures rendered with PDB 1G1S and docking results and plotted with PyMol and APBS plugins.Citation44
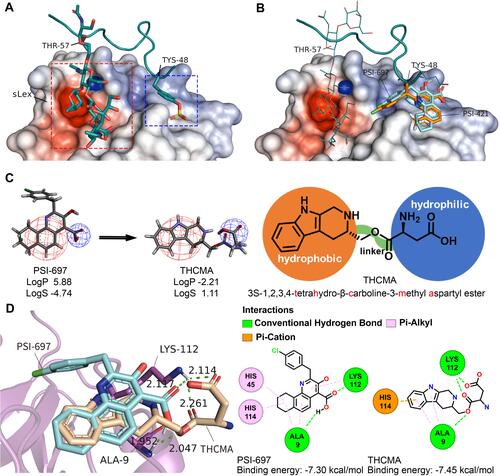
Figure 2 UV spectra of P-selectin influenced by the binding of THCMA and competitive binding of THCMA to P-selectin against PSGL1 expressed on HL60 cells. (A) UV spectra of sP-selectin and PSI-697 (2 μM, 20 μM). (B) UV spectra of increasing amount of PSI-697 with sP-selectin. (C) UV spectra of sP-selectin and THCMA (2 μM, 20 μM). (D) UV spectra of increasing amount of THCMA with sP-selectin. (E) UV spectra of sP-selectin and 1:1 mixture solution (THCMA:PSI-697 1:1, total 2 μM, 20 μM). (F) UV spectra of increasing amount of 1:1 mixture solution with sP-selectin. (G) UV spectra of sP-selectin and 1:3 mixture solution (THCMA:PSI-697 1:3, total 2 μM, 20 μM). (H) UV spectra of increasing amount of 1:3 mixture solution with sP-selectin. (I) Multiple P-selectin tyrosine residues located adjacent to the binding site of THCMA, perhaps attributable to the UV spectra changes of P-selectin. (J) Microscopy of HL60 cells adhered to fixed P-selectin treated with NS. (K) Microscopy of HL60 cells adhered to fixed P-selectin treated with 25 μM PSI-697. (L) Microscopy of HL60 cells adhered to fixed P-selectin treated with 25 μM THCMA. (M) Microscopye of HL60 cells adhered to fixed P-selectin treated with 100 μM THCMA. (N) HL60 cell numbers adhered to the fixed P-selectin on ELISA plates in the presence and absence of THCMA and PSI-697.
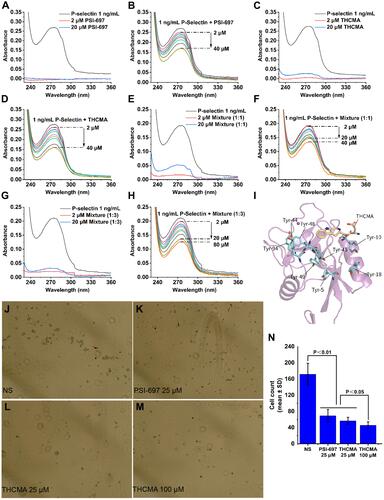
Figure 3 FT-ICR-MS, qCID, NOESY spectra, and THCMA tetramer: (A) FT-ICR-MS spectrum presents peaks of THCMA monomer (318.14566), dimer (635.28299 minus H), trimer (952.42258 minus H), and tetramer (1,269.56151 minus H). qCID spectrum of the THCMA tetramer (1,269.56151 minus H) splits into peaks of trimer, dimer, and monomer. (B) NOESY 2D 1H NMR spectrum presents three cross-peaks in red circles reflecting the intermolecular interactions between 3-H and 6-H, 4-H and 6-H, and 10-H and 6-H. (C) Top view and side view of the constructed THCMA tetramer (CPK model) fulfilling NOESY interaction requirements.
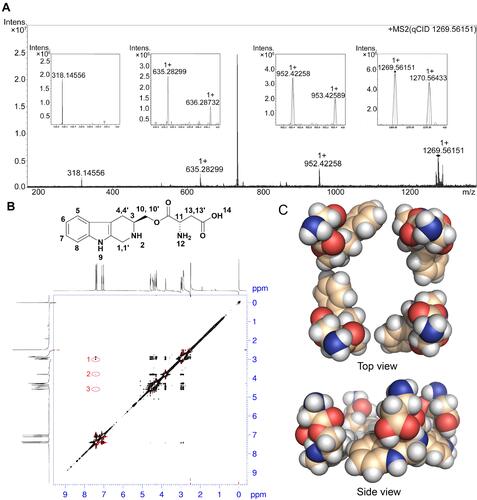
Figure 4 TEM and SEM images, nanoparticle-size distribution, and proposed self-assembly pattern of THCMA nanostructure. (A) TEM of 0.1 μM THCMA water solution at pH 7. (B) Statistical nanoparticle size distribution of THCMA on TEM (n=400). (C) SEM of lyophilized powder of THCMA. (D) Nanoparticle size distribution of THCMA on SEM (n=400). (E) Proposed self-assembly pattern of THCMA nanostructure.
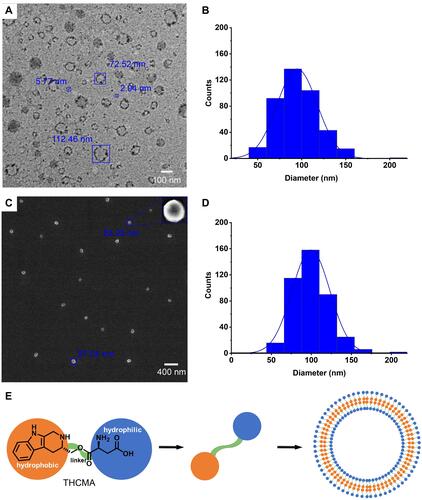
Figure 5 Tyndall effect excited by 650 nm laser (A–J), ζ-potential (K–N) and particle size of THCMA in water over time (O and, P): (A) ultrapure water; (B) 10 μM of THCMA water solution at pH 7.0; (C) 1 μM of THCMA water solution at pH 7; (D) 0.1 μM THCMA water solution at pH 7; (E) 0.01 μM THCMA water solution at pH 7; (F) HCl solution at pH 2; (G) 10 μM THCMA water solution at pH 2; (H) 1 μM THCMA water solution at pH 2; (I) 0.1 μM THCMA water solution at pH 2; (J) 0.01 μM THCMA water solution at pH 2; (K) ζ-potential of THCMA water solution (pH 7, 10 μM); (L) ζ-potential of THCMA water solution (pH 7, 1 μM); (M) ζ-potential of THCMA water solution (pH 7, 0.1 μM); (N) ζ-potential of THCMA water solution (pH 7, 0.01 μM); (O) Particle size of THCMA water solutions over 7 days at pH 7 (10, 1, 0.1, and 0.01 μM); (P) particle size of THCMA solutions over 7 days at pH 2 (10, 1, 0.1, and 0.01 μM).
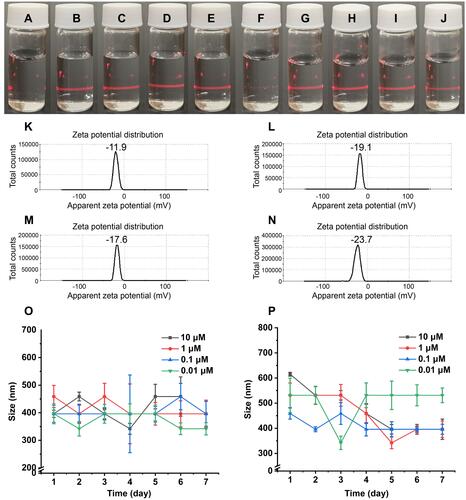
Figure 6 Antithrombosis activity and bleeding-risk, and coagulation-risk evaluations of THCMA. (A) Anti-arterial thrombosis activity of THCMA (n=10); (B) antivenous thrombosis activity of THCMA (n=10); (C) bleeding risk of THCMA (n=10); (D) coagulation indices (PT, TT, APTT, Fib) of THCMA (n=6).
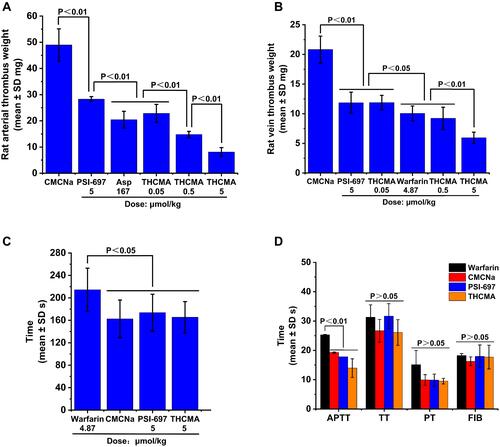
Figure 7 Anti-inflammation and antitumor activity and systemic toxicity of THCMA. (A) Anti-inflammation activity of THCMA (n=10); (B) antitumor activity of THCMA (n=6); (C) effect of THCMA on body weight in S180-bearing mice (n=8); (D) effect of THCMA on organ:body-weight ratios of S180-bearing mice (n=8).
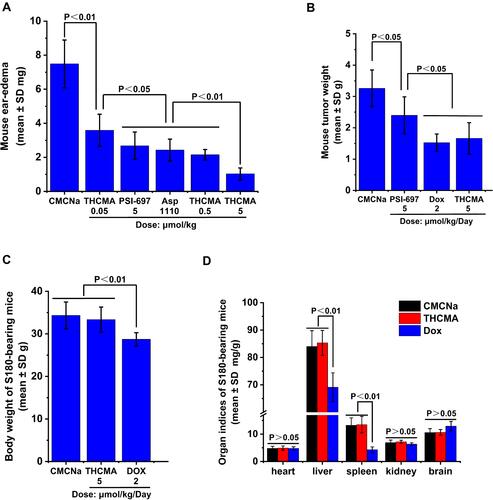
Figure 8 Expression levels of sP-selectin and TNFα in vivo (n=8). (A) sP-selectin expression in arterial thrombosis rats; (B) sP-selectin expression in venous thrombosis rats; (C) sP-selectin expression in S180 mice; (D) sP-selectin expression in ear-edema mice; (E) TNFα expression in ear-edema mice.
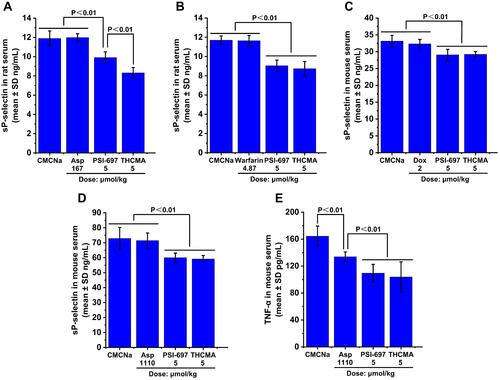
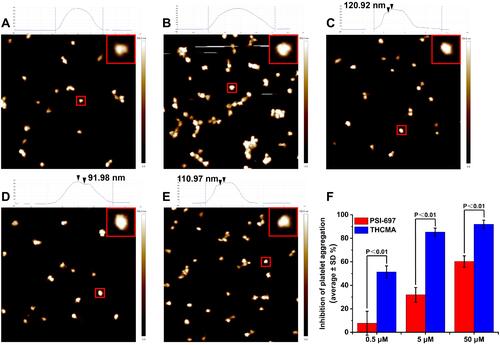
Figure 9 AFM images of platelets at various states with the height of marked platelet shown at top, and anti–platelet aggregation activity of THCMA in vitro. (A) AFM of rat platelets at resting state; (B) AFM of rat platelets activated by AA; (C) AFM of rat platelets activated by AA in the presence of 10 μM THCMA; (D) AFM of rat platelets activated by AA in the presence of 1 μM THCMA; (E) AFM of rat platelets activated by AA in the presence of 0.1 μM THCMA; (F) anti–platelet aggregation activity of THCMA and PSI-697 in vitro (n=6).