Figures & data
Table 1 Levels of experimental factors
Table 2 Orthogonal experiment design and drug entrapment efficiency (%)
Table 3 Drug content of three batches
Figure 1 Transmission electronic microscopic images of PEGylated OA liposomes. (A) Formulation without Tween-80. (B) Tween-80 0.2% (v/v) added to preparation.
Abbreviations: OA, oleanolic acid; PEG, polyethylene glycol.
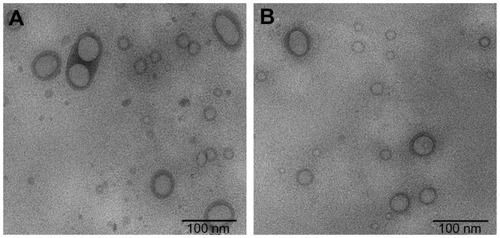
Figure 2 Scan Asyst mode atomic force microscopic images of PEGylated OA liposomes. (A and B) Without Tween-80 and (C and D) with 0.2% (v/v) Tween-80 as a surfactant.
Abbreviations: OA, oleanolic acid; PEG, polyethylene glycol.
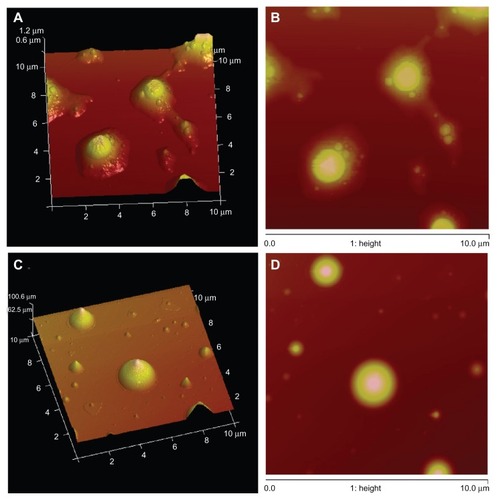
Figure 3 Fourier transform infrared spectra of (A) pure PEG-2000 and (B) PEGylated OA liposomes.
Note: 2% (w/w) of sample was mixed with dry potassium bromide, compressed into KBr disc and then scanned in the range of 4000 cm−1 to 400 cm−1.
Abbreviations: OA, oleanolic acid; PEG, polyethylene glycol.
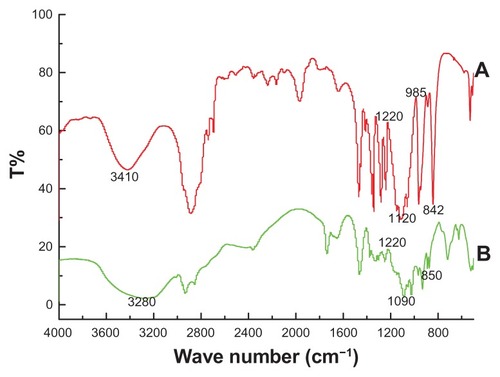
Table 4 Drug contents of PEGylated OA liposomes in different temperatures after several days
Table 5 Entrapment efficiency of PEGylated and non-PEGylated OA liposomes in different conditions
Figure 4 In vitro release of OA, OA liposomes, and PEGylated OA liposomes in phosphate-buffered saline (0.1 M, pH 7.4) at 37°C.
Note: Each value represents the mean ± standard error from three independent experiments.
Abbreviations: OA, oleanolic acid; PEG, polyethylene glycol.
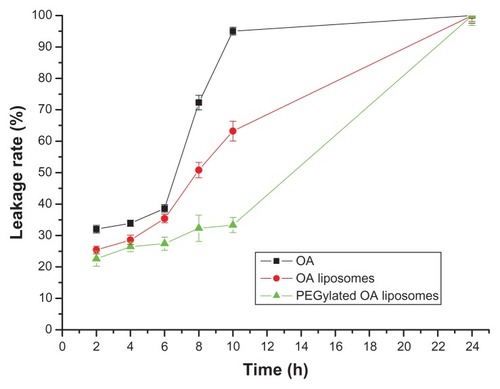
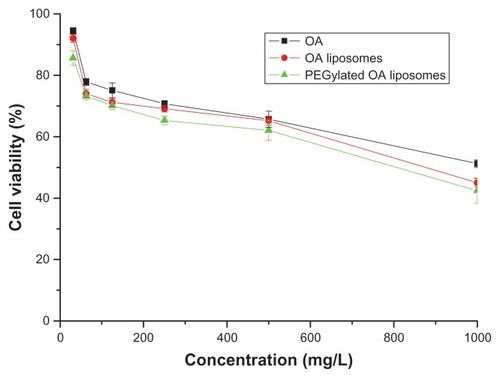
Figure 5 Effect of drug concentration on the inhibition rate of OA, OA liposomes and PEGylated OA liposomes.
Note: Each value represents the mean ± S.E.M from 3 independent experiments.