Figures & data
Figure 1 Rat cremaster muscle preparation for magnetic nanoparticle retention and hemodynamic assessment. Magnetic nanoparticles were injected into the perfusion line that was cannulated into the left femoral artery in a retrograde manner, reaching the pudic epigastric artery, the branch supplying blood to the left cremaster muscle. A neodymium magnet with a radius of 9 mm was placed underneath the dissected muscle layer on the left, as depicted with a dotted circle, for magnetic nanoparticle capture (A). The image of the muscle pieces of a representative rat was taken using a digital camera (B). The magnetic field of the magnet was measured with a Gauss meter and plotted as a function of distance from the center of the magnet (C).
Note: The tip of the probe of the Gauss meter was placed 0, 1, 2, and 3 mm from the surface along the axial direction of the cylindrical magnet, as indicated.
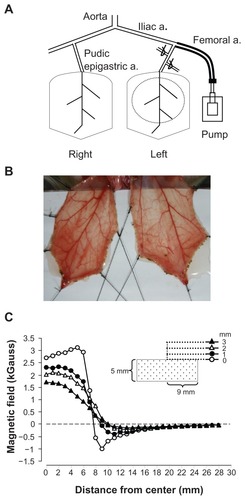
Figure 2 Magnetic nanoparticles (MNPs) attenuated cremaster blood flow in a dose-dependent manner. Accumulative doses of MNPs (1, 5, and 10 mg/kg) were administered via the pudic epigastric artery feeding the left cremaster muscle with a magnet placed underneath. Laser speckle images (Flux) and photo images after each MNP dose or at the end of the experiment for prolonged (p) exposure in a representative rat are illustrated (A); continuous recordings of blood pressure (BP) and the tissue flow (flux; arbitrary unit PU) of the right (control) and the left (MNP) cremaster muscle of this rat are illustrated with time (B).
Notes: The arrowheads in the photo image of 5 mg/kg MNPs indicate two of the major sites of MNP deposit in vessels. The effect of cremaster flow is summarized as % basal flow (C; n = 5). *P < 0.05 compared with the basal value; #P < 0.05 compared with corresponding control value.
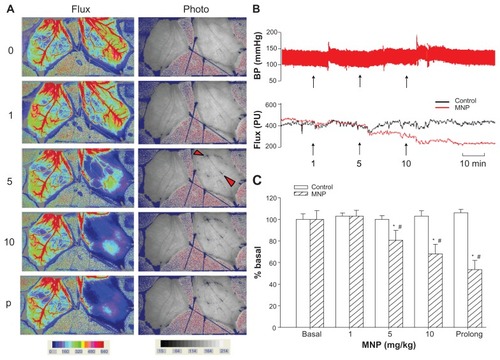
Figure 3 A magnetic field caused magnetic nanoparticle (MNP) retention in cremaster vasculature. In response to accumulative doses of MNPs (10 mg/kg; i.a.), MNP retention in the cremaster vasculature was demonstrated with Prussian blue staining (A). Both photo images and an image from a micro-CT scanner demonstrate MNP retention in the left cremaster muscle of a representative rat, which is associated with reduced tissue perfusion (B).
Notes: Quantitative analysis of cremaster tissue iron content by inductively coupled plasma optical emission spectroscopy at the end of the experiment is illustrated (C; n = 5). Values are presented as mean ± SE. *P < 0.05 compared with the control group.
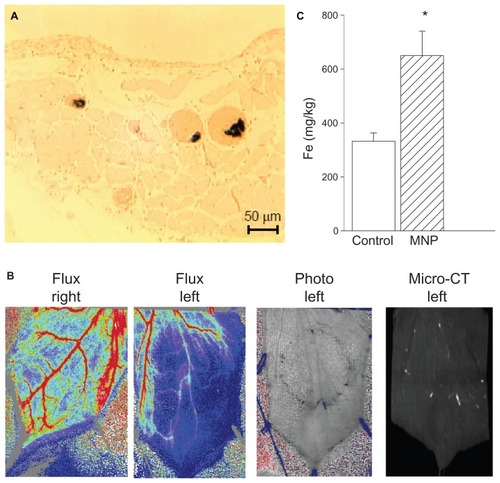
Figure 4 Representative effects of magnet removal-induced MNP dissipation on tissue perfusion in cremaster muscle microcirculation.
Notes: Flux and photo views of both the left (L) vs right (R) cremaster muscle before (Basal) and after MNPs (+MNP; 5 mg/kg) administered to the left cremaster muscle with the magnet underneath the muscle piece are illustrated. Ten minutes after +MNP, the magnet was removed (−Mag); MNP dissipation was recorded approximately 30 minutes after removal of the magnet. Results of the frequency analysis of the perfusion map are illustrated as % bin in the right panel.
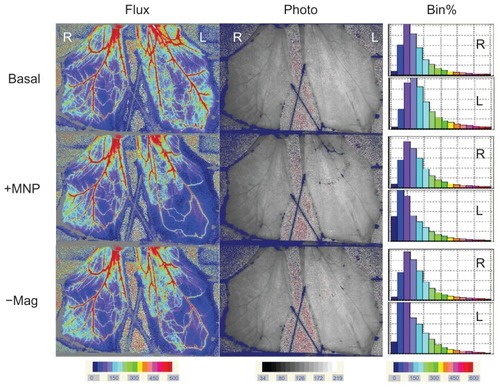
Figure 5 Analysis of hemodynamic effects induced by magnet removal. MNPs at doses of 5 (n = 11) or 10 (n = 8) mg/kg were administered to the left cremaster muscle with magnet placement; the right cremaster muscle served as the control. Ten minutes after MNP administration, the magnet was removed. The perfusion of the left cremaster muscle was analyzed as a whole (A) or in parts (B; 5 mg/kg MNP only) of muscle pieces.
Notes: Relative tissue perfusion on the magnet and upstream/downstream of the magnet were analyzed. *P < 0.05 compared with basal values of the corresponding group; #P < 0.05 compared with control values of the corresponding group; †P < 0.05 compared with corresponding levels before magnet removal (+MNP).
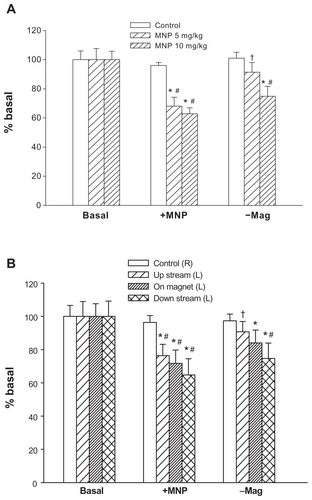
Figure 6 Ultrasound partially restored tissue perfusion of the left cremaster muscle after magnet removal.
Notes: Administration of MNPs (10 mg/kg; +MNP) was followed by magnet removal (−Mag) and application of ultrasound (+US) on the left (L) cremaster muscle piece, with the right (R) cremaster muscle as the control. Results of the frequency analysis of the perfusion map are illustrated as % bin in the right panel. These results are representative of four experiments.
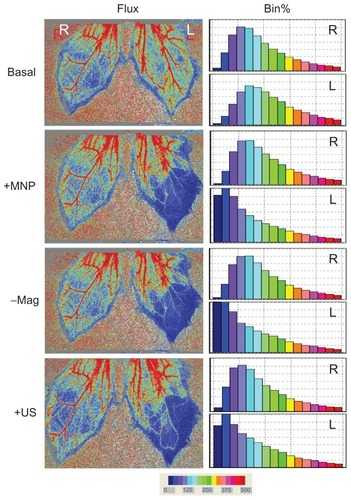
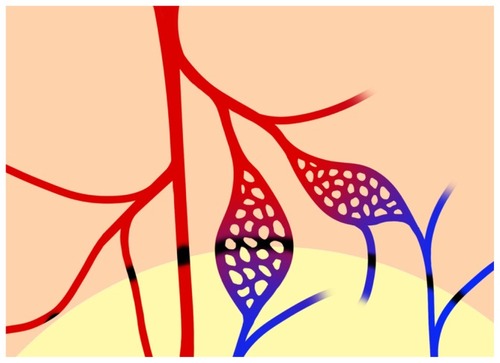
Figure 7 Schematic diagram of MNP retention along the edge of the magnet.
Notes: From left to right, MNP retention may occur in the lumen of the 2nd arteries, the major artery (in red), the capillaries, and the venules (in blue) in the cremaster muscle preparation. MNP deposit (in black) may occur at the margin of the magnet, which may completely or partially block flow in the microvessels. The lower part of the figure with the light background indicates the location of a neodymium magnet underneath the muscle layer.