
Figures & data
Figure 1 (A) Determination of CMC by DLS: A comparative plot of intensity of scattered light (left axis, ★) and hydrodynamic diameter (right axis, ■) as a function different polymer concentrations (B) Schematic presentation for the preparation of TAC loaded polymeric micelles (C) TEM micrograph showing morphology of A10 and B10 with core–shell structure and (D) particle size distribution diagram of A10 and B10.
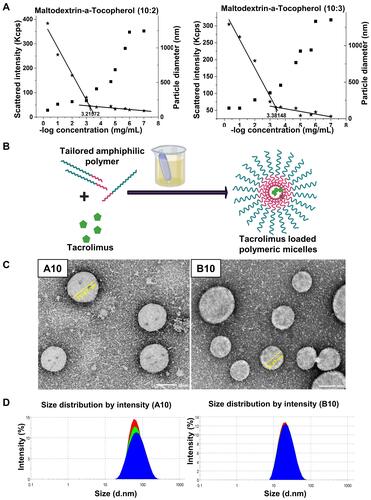
Table 1 Primers Sequences Used for qRT-PCR in AIA Study
Table 2 Physico-Chemical Characterization of Maltodextrin-A-Tocopherol Conjugates
Figure 2 Solid state characterization (A) DSC thermograms of TAC, A10 and B10. (B) FT-IR spectra of TAC, A10, B10, maltodextrin-α-tocopherol (10:2) and maltodextrin-α-tocopherol (10:3).
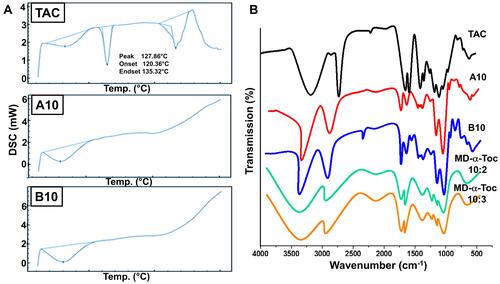
Table 3 Effect of DD Value, Polymeric Composition Ratio of Maltodextrin-α-Tocopherol Nano-micelles and TAC Ratios on the Following: Particle Size, Zeta Potential, PDI, and EE%
Figure 3 (A) In vitro drug release of TAC from A10, B10 and its ethanolic solution in PBS (pH 7.5, pH 6.5 and pH 5.5) at 100 rpm and 37°C using the dialysis bag method. Physical stability of A10 and B10 micelles stored at 4°C over 3 months expressed as (B) change in particle size, PDI, (C) zeta potential and EE% with time. (D) Serum stability of A10 and B10 in 10% fetal bovine serum (FBS) solution. Physical stability of A10 and B10 micelles at dilution factors (10, 50, and 100) expressed as change in (E) particle size and (F) PDI.
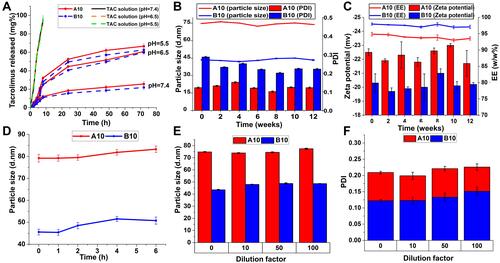
Figure 4 In vitro toxicological assessment (I): Hemolytic activity test of A10 and B10 expressed as (A) % hemolysis (mean±SD) and (B) optical microscopic images of RBCs at the end of hemolysis test. Cytotoxicity test by MTT assay of prepared A10 and B10 on (C) Vero kidney cell line and on (D) PBMCs cell line after 48h of incubation [* P≤ 0.05 vs TAC, mean ± SD].
![Figure 4 In vitro toxicological assessment (I): Hemolytic activity test of A10 and B10 expressed as (A) % hemolysis (mean±SD) and (B) optical microscopic images of RBCs at the end of hemolysis test. Cytotoxicity test by MTT assay of prepared A10 and B10 on (C) Vero kidney cell line and on (D) PBMCs cell line after 48h of incubation [* P≤ 0.05 vs TAC, mean ± SD].](/cms/asset/fe14ab38-483c-4ca2-b513-252233615f77/dijn_a_12192433_f0004_c.jpg)
Figure 5 In vivo toxicological assessment (II): (A) Kaplan-Meier survival curve for the overall survival of rats during sub-acute toxicity study. (B) Mean body weight (mean ± SEM) [* significantly increase vs 0-time, ** significantly decrease vs 0-time, P≤ 0.05]. (C) Photomicrographs of H and E stained kidney sections of rats treated with TAC, A10, and B10 showing renal cortex of renal corpuscle (RC), proximal (PT) and distal (DT) tubules and liver sections showing central vein (CV), radiated hepatic cords (*) and hepatic sinusoids (arrows) (original magnifications ×400) and (D) kidney (Bowman space area) and liver (sinusoids area) histological scores of TAC, A10, and B10 treated groups [* P≤ 0.05 vs TAC, mean ± SD].
![Figure 5 In vivo toxicological assessment (II): (A) Kaplan-Meier survival curve for the overall survival of rats during sub-acute toxicity study. (B) Mean body weight (mean ± SEM) [* significantly increase vs 0-time, ** significantly decrease vs 0-time, P≤ 0.05]. (C) Photomicrographs of H and E stained kidney sections of rats treated with TAC, A10, and B10 showing renal cortex of renal corpuscle (RC), proximal (PT) and distal (DT) tubules and liver sections showing central vein (CV), radiated hepatic cords (*) and hepatic sinusoids (arrows) (original magnifications ×400) and (D) kidney (Bowman space area) and liver (sinusoids area) histological scores of TAC, A10, and B10 treated groups [* P≤ 0.05 vs TAC, mean ± SD].](/cms/asset/a9d2f109-d428-4c71-959c-203d988f310f/dijn_a_12192433_f0005_c.jpg)
Figure 6 Assessment of AIA model (I): (A) Experimental timeline of the AIA model used showing induction and treatment protocols. (B) Mean body weights (mean ± SEM) during induction and treatment period [** significantly increase vs 14 days reading, * significantly decrease vs 0-time, P≤ 0.05]. (C) Images of hind paws of different treated groups at 0, 14- and 28-days post-induction (NC= negative control and PC= positive control), [red circle= severe inflammation, blue circle= mild inflammation, yellow circle= no inflammation].
![Figure 6 Assessment of AIA model (I): (A) Experimental timeline of the AIA model used showing induction and treatment protocols. (B) Mean body weights (mean ± SEM) during induction and treatment period [** significantly increase vs 14 days reading, * significantly decrease vs 0-time, P≤ 0.05]. (C) Images of hind paws of different treated groups at 0, 14- and 28-days post-induction (NC= negative control and PC= positive control), [red circle= severe inflammation, blue circle= mild inflammation, yellow circle= no inflammation].](/cms/asset/9a7ca639-f6e0-47ac-96a4-2b20c84042ff/dijn_a_12192433_f0006_c.jpg)
Table 4 Effect of Acute IV Administration of Free TAC, A10, B10 on Hematological Parameters in Rats
Table 5 Effect of Acute IV Administration of Free TAC, A10, B10 on Biochemical Parameters in Rats
Figure 7 Assessment of AIA model (II): (A) Clinical arthritis score (mean ± SEM) [* significantly decreased after treatment, P≤ 0.05] and (B) paw thickness (mean ± SEM) [* significantly decreased after treatment, P≤ 0.05].
![Figure 7 Assessment of AIA model (II): (A) Clinical arthritis score (mean ± SEM) [* significantly decreased after treatment, P≤ 0.05] and (B) paw thickness (mean ± SEM) [* significantly decreased after treatment, P≤ 0.05].](/cms/asset/921dc933-d309-4971-bc28-f551cddec0ed/dijn_a_12192433_f0007_c.jpg)
Figure 8 Concentration of pro-inflammatory cytokines. (A) Serum level of IL-6, (B) synovial fluid level of IL-6, (C) serum level of TNF-a, and (D) synovial fluid level of TNF-a [* P≤ 0.05 vs PC, ** P≤ 0.05 vs PC and TAC groups, mean± SEM, n = 5].
![Figure 8 Concentration of pro-inflammatory cytokines. (A) Serum level of IL-6, (B) synovial fluid level of IL-6, (C) serum level of TNF-a, and (D) synovial fluid level of TNF-a [* P≤ 0.05 vs PC, ** P≤ 0.05 vs PC and TAC groups, mean± SEM, n = 5].](/cms/asset/35101cc4-2b5a-4074-8155-d1d784580df3/dijn_a_12192433_f0008_c.jpg)
Figure 9 Concentration of bone and cartilage formation proteins: Level of osteocalcin protein in (A) serum, (B) synovial fluid and (C) its mRNA expression. Level of osteopontin protein in (D) serum, (E) synovial fluid and (F) its mRNA expression. level of SOX9 chondrogenic protein in (G) serum, (H) synovial fluid and (I) mRNA expression of SOX9 chondrogenic protein. [* P≤ 0.05 vs PC, ** P≤ 0.05 vs PC and TAC groups, mean± SEM, n = 5].
![Figure 9 Concentration of bone and cartilage formation proteins: Level of osteocalcin protein in (A) serum, (B) synovial fluid and (C) its mRNA expression. Level of osteopontin protein in (D) serum, (E) synovial fluid and (F) its mRNA expression. level of SOX9 chondrogenic protein in (G) serum, (H) synovial fluid and (I) mRNA expression of SOX9 chondrogenic protein. [* P≤ 0.05 vs PC, ** P≤ 0.05 vs PC and TAC groups, mean± SEM, n = 5].](/cms/asset/b3e6d06e-928f-430b-a1b2-48aa60f0f18a/dijn_a_12192433_f0009_c.jpg)
Figure 10 Histopathologic evaluation of AIA model paws. (A) H&E staining, ×200. (NC) Negative control group showing normal tissue, (PC) positive control group showing intense inflammatory infiltrate (blue arrow), extensive pannus formation (red arrow) and intense bone erosion (yellow arrow), (TAC susp.) group with moderate inflammatory infiltrate, moderate pannus formation (red arrow) and mild bone erosions (yellow arrow), (A10) group with moderate inflammatory infiltrate (blue arrow), no pannus, normal cartilage, and bone, (A10 blank) group showing moderate inflammatory infiltrate (blue arrow) with mild pannus formation (red arrow), (B10) group with mild inflammatory infiltrate (blue arrow), no pannus, normal cartilage, and bone, (B10) blank group showing severe inflammatory infiltrate (blue arrow) with mild pannus formation (red arrow). (B) Alcian blue staining, ×200. (NC) with normal bone and cartilage (blue color, black arrow), (PC) with intense cartilage and bone erosion (black arrows), (Tac susp.)with mild cartilage erosion (black arrow), (A10) with normal cartilage and bone (blue color, black arrow), (A10 blank) with mild cartilage erosion and normal bone (black arrow), (B10) with normal cartilage and bone (blue color, black arrow), (B10 blank) with mild cartilage erosion and normal bone (black arrow). (C) Histological scores of synovial inflammations, pannus formation, cartilage and bone erosion. [* P≤ 0.05 vs TAC groups, mean± SEM, n = 5].
![Figure 10 Histopathologic evaluation of AIA model paws. (A) H&E staining, ×200. (NC) Negative control group showing normal tissue, (PC) positive control group showing intense inflammatory infiltrate (blue arrow), extensive pannus formation (red arrow) and intense bone erosion (yellow arrow), (TAC susp.) group with moderate inflammatory infiltrate, moderate pannus formation (red arrow) and mild bone erosions (yellow arrow), (A10) group with moderate inflammatory infiltrate (blue arrow), no pannus, normal cartilage, and bone, (A10 blank) group showing moderate inflammatory infiltrate (blue arrow) with mild pannus formation (red arrow), (B10) group with mild inflammatory infiltrate (blue arrow), no pannus, normal cartilage, and bone, (B10) blank group showing severe inflammatory infiltrate (blue arrow) with mild pannus formation (red arrow). (B) Alcian blue staining, ×200. (NC) with normal bone and cartilage (blue color, black arrow), (PC) with intense cartilage and bone erosion (black arrows), (Tac susp.)with mild cartilage erosion (black arrow), (A10) with normal cartilage and bone (blue color, black arrow), (A10 blank) with mild cartilage erosion and normal bone (black arrow), (B10) with normal cartilage and bone (blue color, black arrow), (B10 blank) with mild cartilage erosion and normal bone (black arrow). (C) Histological scores of synovial inflammations, pannus formation, cartilage and bone erosion. [* P≤ 0.05 vs TAC groups, mean± SEM, n = 5].](/cms/asset/c64ee6e9-e318-4857-a9a2-d5094aebda8c/dijn_a_12192433_f0010_c.jpg)