Figures & data
Figure 1 Conceptual diagram of dielectric sphere-mediated perforation using femtosecond (fs) laser.
Notes: Biodegradable spheres are conjugated to cell membrane via antigen– antibody interaction. Femtosecond laser illumination to the spheres generates a strongly enhanced optical field under the sphere for perforation.

Figure 2 (A–D) Optical intensity distributions on the yz plane simulated by the three-dimensional finite-difference time-domain method for PLA spheres of different diameters: (A) 250 nm, (B) 500 nm, (C) 1000 nm, and (D) 2000 nm. A plane wave is illuminated to the sphere with the wave vector in the z direction. The incident wave of 800 nm in wavelength is linearly polarized along the x-axis. (E–G) Optical intensity distributions along (E) the z-axis under the sphere, (F) the x-axis under the sphere on the peak intensity, shown as red horizontal line in A–D, and (G) the y-axis under the sphere on the peak intensity. (H) Relative positions of focused far field, PLA sphere, and cell membrane on yz plane in the case of 2000 nm PLA sphere.
Note: Dashed circle and gray plane indicate the positions of the PLA sphere and the cell membrane, respectively.
Abbreviations: FWHM, Width at half maximum; PLA, polylactic acid.
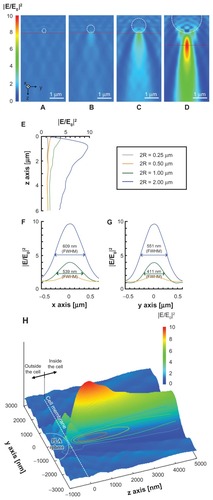
Figure 3 Phase contrast image of the A431 cells before laser illumination.
Note: The polylactic acid spheres with a diameter of 2000 nm conjugated to the surface of the cells.
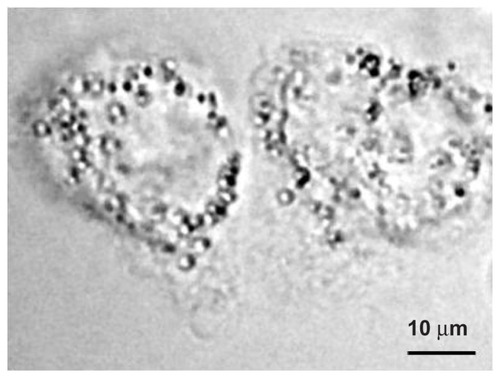
Figure 4 Fluorescence (A and C) and phase contrast (B and D) images of A431 cells perforated by using antibody-conjugated polylactic acid spheres irradiated by a single fs laser pulse at 1.06 J/cm2 in the presence of fluorescein isothiocyanate-dextran (A and B) and Alexa Fluor-labeled small interfering RNA (C and D).
Note: Dashed circles (300 μm diameter) indicate the laser irradiated area.
Abbreviation: fs, femtosecond.
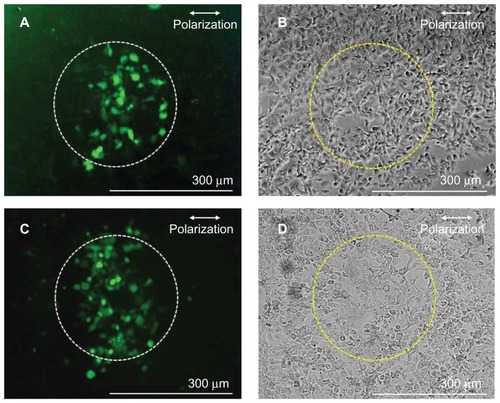
Figure 5 Dependence of perforation efficiency evaluated by using fluorescein isothiocyanate-dextran (closed squares) and survival rate (open squares) on the laser fluence.
Notes: A single shot of 80-fs laser pulse was irradiated. The corresponding peak focused intensity under the polylactic acid sphere which was derived from is also shown on the top horizontal axis.
Abbreviation: fs, femtosecond.
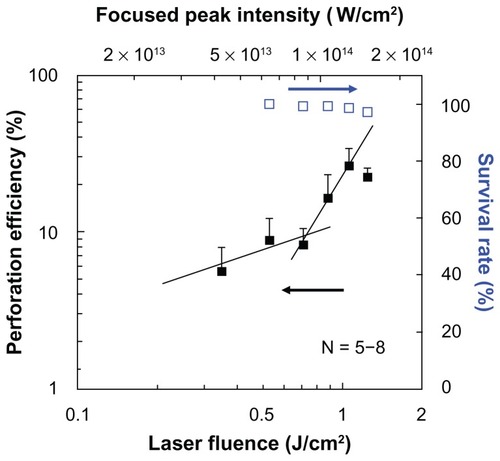
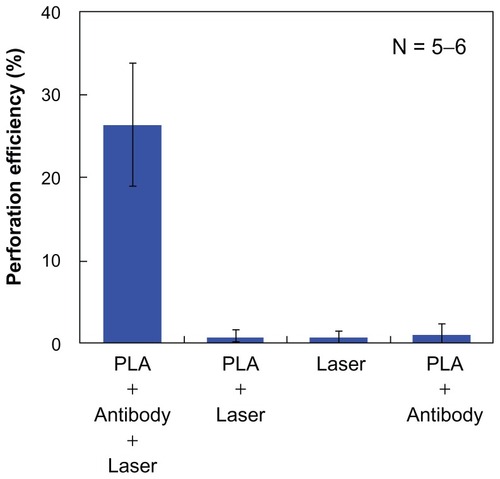
Figure 6 Average perforation efficiency under four different conditions.
Note: A single 80 fs laser pulse was irradiated at 1.06 J/cm2 (1.29 × 10¹⁴ W/cm2 under the PLA sphere).
Abbreviations: fs, femtosecond; PLA, polylactic acid.