Figures & data
Figure 1 Scheme of the synthesis of an amino spacer on polylactide.
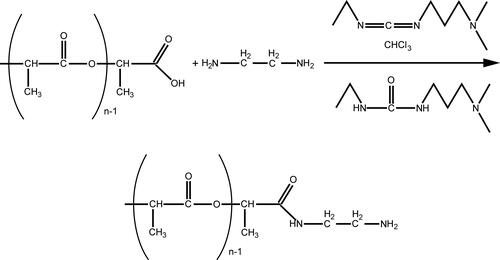
Figure 2 PLA-EDA-ICG conjugate.
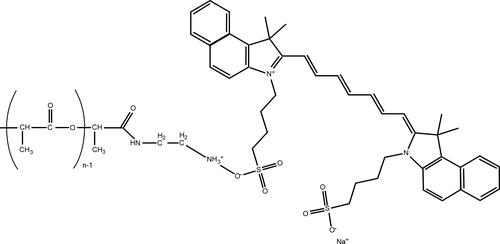
Figure 3 Block diagram of the setup for studies of the permeability of the walls of the carotid artery. 1 - storage tank, 2 - peristaltic pump, 3 - mechanism for introducing suspension with MNP into the circuit, 4 - flow meter, 5 - pressure sensor in the circuit, 6 - heat exchanger, 7 - chamber with vessels, 8 - magnetic field source, 9 - balloon with carbogen.
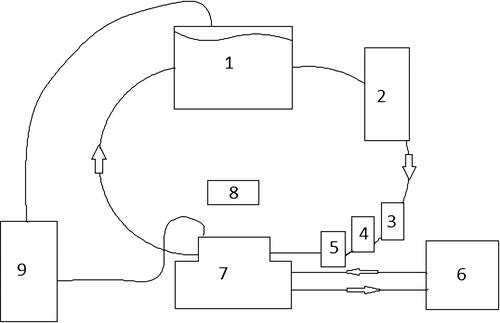
Figure 4 The chamber in which the vessels are placed. 1 - cannulas for lowering vessels, 2 - external chamber, 3 - small chamber. The arrows show the direction of the model fluid.
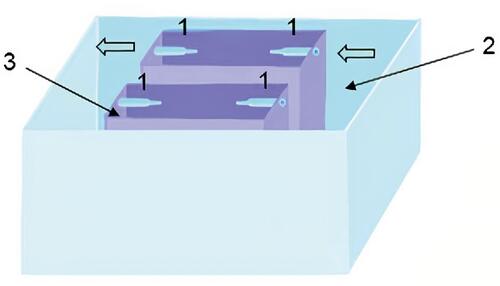
Figure 5 Physical characteristics of the suspension: (A) particle size distribution; (B) distribution of particles over zeta potential; (C) TEM photograph of nanoparticles.
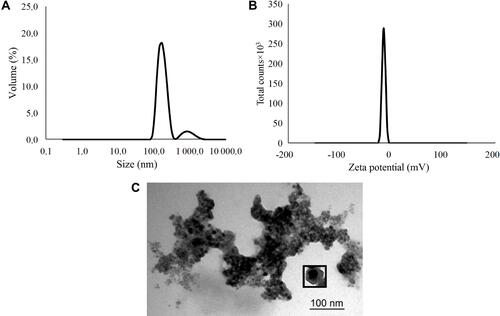
Figure 6 Legend for a permanent magnet.
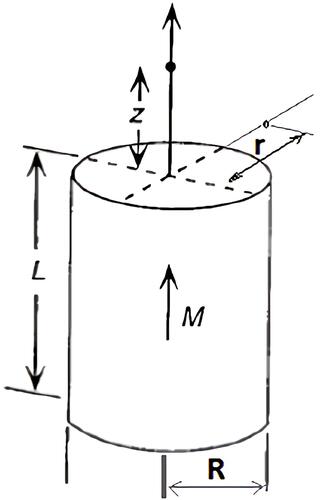
Figure 7 The component of the magnetic induction Bz along the axis of the magnet Oz; magnet standard size: black line 0.5×2 mm, blue line 2×2 mm, green line 3×2 mm, red line 5×2 mm.
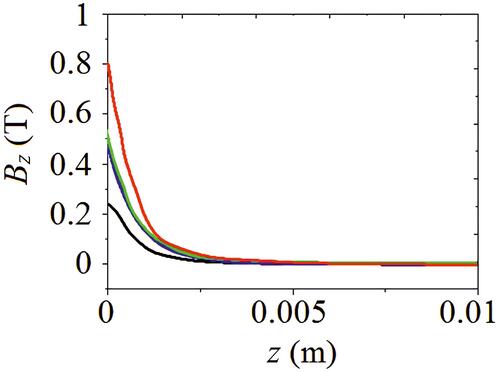
Figure 8 Magnetic induction component Brperpendicular to the magnet axis Oz; magnet standard size: black line 0.5×2 mm, blue line 2×2 mm, green line 3×2 mm, red line 5×2 mm.
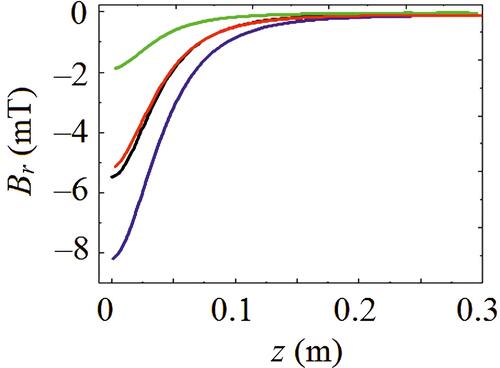
Figure 9 The component of the magnetic induction Bz at a distance r from the axis at the end of the magnet (z = 0); magnet standard size: black line 0.5×2 mm, blue line 2×2 mm, green line 3×2 mm, red line 5×2 mm.
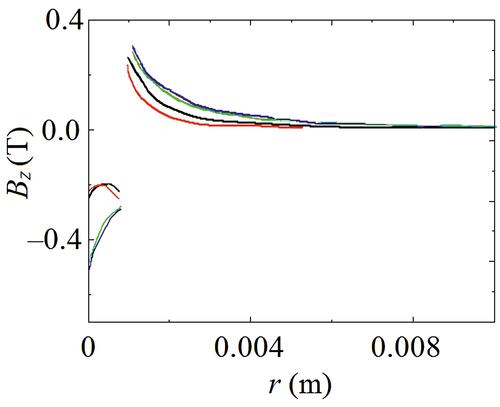
Figure 10 The component of the magnetic induction Bralong the radial direction; magnet standard size: black line 0.5×2 mm, blue line 2×2 mm, green line 3×2 mm, red line 5×2 mm.
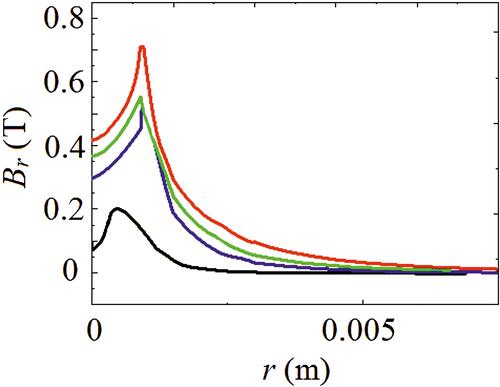
Figure 11 Permanent magnet field lines.
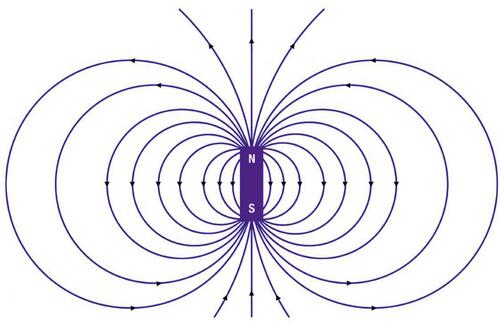
Table 1 Quantitative Determination of Magnetized MNP
Table 2 Measured Values of the Concentration of Magnetite MNP on a Spectrophotometer
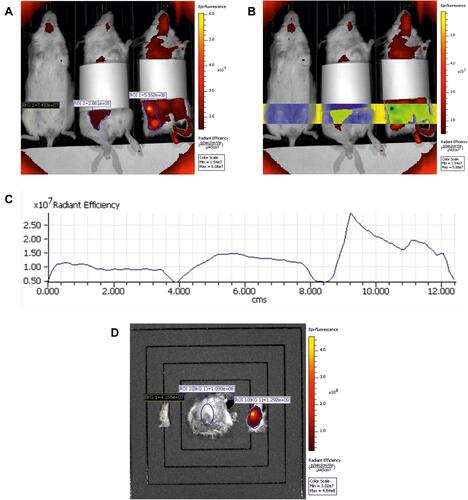
Table 3 Measured Values of Luminous Efficacy of Fluorescent Emission of Samples
Figure 12 Fluorescence of in vitro samples: (A and B) - from left to right 20-fold excess of reagents; 200-fold excess of reagents (A) PLA-EDA-ICG conjugate; (B) MNP-PLA-EDA-ICG.
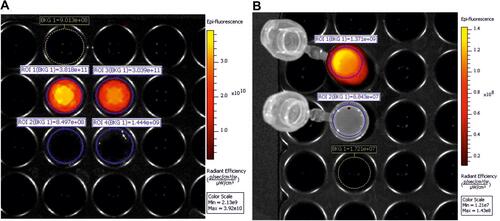
Figure 13 Accumulation of MNPs-ICG in the liver at different points in time: (A and B) — from left to right — control animal; introduction of MNPs-ICG; introduction of MNPs-ICG with the creation of a magnetic field in the area of the tumor; (A) 1 minute after administration; (B) 15 minutes after administration (arrow indicates location of tumor).
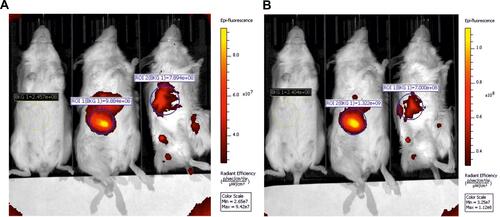
Figure 14 Accumulation of MNPs-ICG in a tumor: (A–C) from left to right - control animal; introduction of MNPs-ICG; introduction of MNPs-ICG with the creation of a magnetic field in the area of the tumor; (A) accumulation of MNPs-ICG in the tumor; (B) cross-section of the horizontal fluorescence measurement map; (C) light output in a horizontal section; (D) fluorescence of the removed organ, from left to right: background (control), organ with the introduction of the conjugate, organ with the introduction of the conjugate and exposure to a magnetic field (arrow indicates location of tumor).