Figures & data
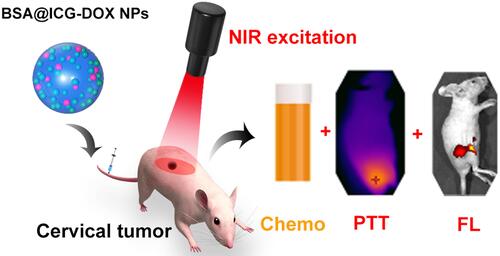
Scheme 1 Schematic illustration of BSA@ICG-DOX NPs for NIR fluorescence image-guided chemo/photothermal therapy of cervical cancer. (A) The preparation of BSA@ICG NPs and BSA@ICG-DOX NPs; (B) BSA@ICG-DOX NPs tissue accumulation elevates anti-tumor activities.
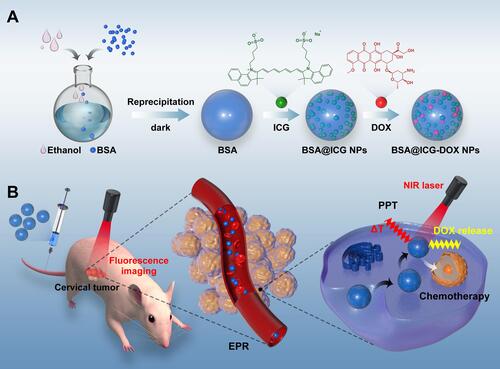
Figure 1 Characterization of BSA@ICG NPs and BSA@ICG-DOX NPs in an aqueous dispersion. (A) Absorption spectra of free ICG (200 µg/mL), BSA@ICG NPs (200 µg/mL) and BSA@ICG-DOX NPs (150 µg/mL) in an aqueous dispersion; (B) Fluorescence spectra of free ICG, BSA@ICG NPs and BSA@ICG-DOX NPs in an aqueous dispersion. (C) and (D) DLS and polydispersity index (PDI) results of BSA@ICG NPs and BSA@ICG-DOX NPs. Inset: Representative TEM images of BSA@ICG NPs and BSA@ICG-DOX NPs. A theranostic nanocomplex that is self-assembled from ICG and BSA is prepared and optimized for enhanced tumor imaging and excellent hydrolytic stability.
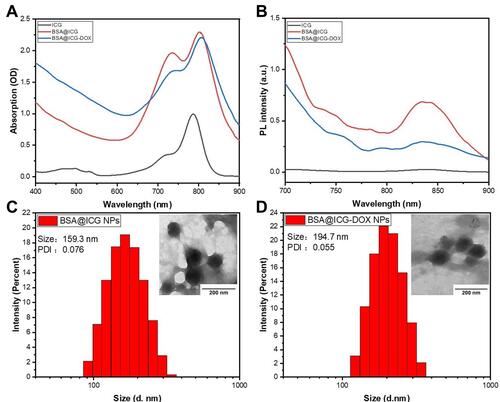
Figure 2 Photothermal properties of BSA@ICG NPs. (A) Schematic illustration of in vitro photothermal experimental system; (B) Temperature elevation curves of various agents (free ICG, DOX, BSA, BSA@ICG NPs) (equivalent concentration of ICG at 200 µg/mL) under NIR laser irradiation for 10 min; (C) Temperature elevation of BSA@ICG NPs at various concentrations under NIR laser irradiation; (D) Temperature elevation of BSA@ICG NPs (200 µg/mL) under NIR laser irradiation with different power density; (E) Infrared thermal images of ICG, BSA, and BSA@ICG NPs in an aqueous dispersion under NIR laser irradiation; (F) Temperature evaluation of BSA@ICG NPs (concentration of ICG:200 µg/mL) in aqueous dispersion under 5 irradiation/cooling cycles; Excitation: 808 nm, Power density: 0.4 W/cm2.
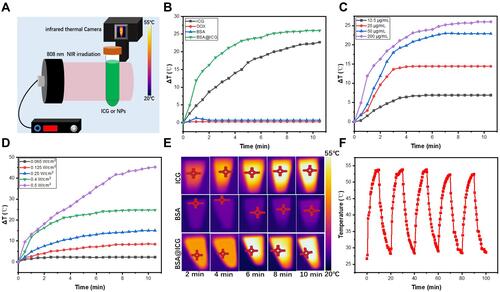
Figure 3 Cellular uptake analysis. (A) Cytoviability of Hela cells after incubation with BSA@ICG NPs at different concentrations for 24 h. Data are expressed as mean ± S.D. (n = 6 in each concentration) (B) Cytoviability of Hela cells after incubation with DOX at different concentrations for 24 h. Data are expressed as mean ± S.D. (n = 6 in each concentration) (C) Confocal scanning laser microscopic (CSLM) images of Hela cells incubated with free ICG, BSA@ICG NPs, and BSA@ICG-DOX (equivalent ICG concentration: 100 μg/mL) for 4 h (scale bars: 50 µm); the excitation for DAPI and ICG were 405 nm and 640 nm, respectively.
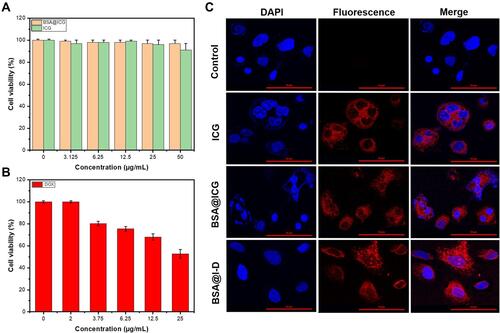
Figure 4 NIR fluorescence images of BSA@ICG NPs (A) Bright-field (BF) and NIR fluorescence (FL) images of ICG, BSA@ICG NPs, BSA@ICG-DOX NPs (BSA@I-D) (equivalent concentration of ICG at 200 µg/mL) under the in vivo NIR fluorescence imaging system; (B) NIR fluorescence images of BSA@ICG NPs injected tumor-bearing nude mice (black dotted circles are subcutaneous tumor site) and major organs at 48 h post injection. Ex: 745 nm, Em: 840 nm.
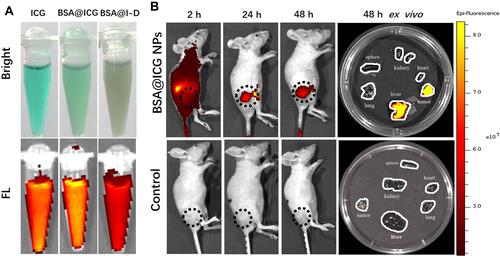
Figure 5 Evaluation of in vivo antitumor efficiency. (A) Infrared thermographic images of the HeLa cell tumor-bearing mice after NIR irradiation (808 nm, 0.4 W/cm2, 10 min). (B) The corresponding temperature elevation curves for ; (C) Tumor-bearing nude mice with dashed circles in the bright field images after various treatments and (D) Images of treated mice and their corresponding tumors excised at the 14th day.; (E) Variation of relative tumor volumes in vivo 2 weeks after various treatments; Data were displayed as the mean ± SD (n =4, ***p < 0.001 between two groups).
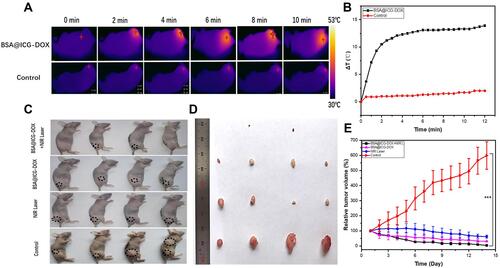
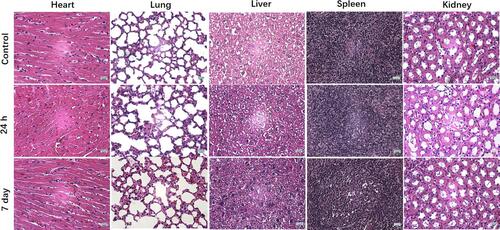
Figure 6 Histological analysis of major organs (heart, liver, spleen, lung, and kidney). BSA@ICG-DOX NPs from treated mice 24 h after intravenous injection and at day 7 post-injection (counted by ICG concentration). Scale Bar = 12.5 µm.