Figures & data
Figure 1 Characterization of the DMP-039/mRNA complex. (A) Size distribution of DMP-039 and mBim/DMP-039. (B) Zeta potential of DMP-039 and mBim/DMP-039. (C) Transmission electron microscopy (TEM) photomicrographs of DMP-039 stained by phosphotungstic acid solution (scale bar: 400 nm). (D) Cell viability assay of DMP-039 and PEI25K on 293T cells. (E) In vitro transcribed murine Bim mRNA (mBim) resolved by electrophoresis. (F) Gel retarding assay of the DMP-039/mRNA complex. (G) RNase protection assay of the mBim/DMP-039 complex.
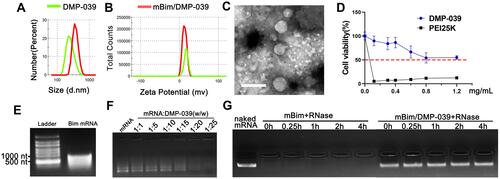
Figure 2 In vitro gene transfection by the DMP-039/mRNA complex. (A) Fluorescence microscopy images of C26 and 293T cells (scale bar: 100 μm). (B) The efficiency of transfection of C26 cells (***P < 0.001, ****P < 0.0001) and (C) 293T cells (**P < 0.01, ***P < 0.001) analyzed by flow cytometry.
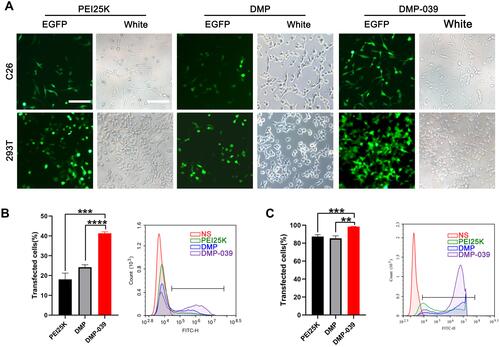
Figure 3 Study on the cellular uptake mechanism of the DMP-039/mRNA complex. (A) Fluorescent images of internalization of the DMP-039/mRNA complex after being treated with various inhibitors; the uptake rates were calculated by flow cytometry (scale bar: 100 μm) (*P < 0.05, ****P < 0.0001). Representative EGFP mRNA signals are marked by white arrows. (B) The internalization of the DMP/mRNA complex was found to be suppressed only by methyl-β-cyclodextrin, as determined by fluorescent microscopy and flow cytometry (scale bar: 100 μm) (***P < 0.001). Representative EGFP mRNA signals are marked by white arrows. (C) The internalization of the DMP-039/mRNA complex was obviously suppressed by cRGD-R9 (200 mg/μL), as determined by fluorescent microscopy and flow cytometry (scale bar: 100 μm) (****P < 0.0001). Representative EGFP mRNA signals are marked by white arrows. All cell nuclei were stained with Hoechst (blue), and plasma membranes were stained with Dil (red) (scale bar: 100 μm).
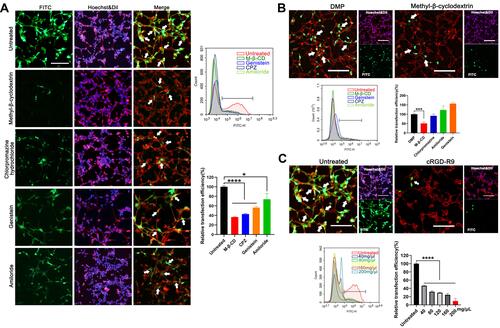
Figure 4 In vitro anti-cancer study of the mBim/DMP-039 complex. (A) The level of Bim mRNA in C26 cells after transfection (**P < 0.01). (B) The level of Bim protein in each treatment group. (C) Image of C26 cells after treatment with the mBim/DMP-039 complex (scale bar: 100 μm) (**P < 0.01, ****P < 0.0001). Cell viabilities were measured by the MTT assay. (D) Detection of the anti-proliferation effect of the mBim/DMP-039 complex by clonogenic assay. Inhibition rates were calculated based on clone numbers (***P < 0.001, ****P < 0.0001). (E) The mBim/DMP-039 complex efficiently induced apoptosis in C26 cells as determined by flow cytometry (**P < 0.01). (F) Western blot analysis of apoptosis-related proteins.
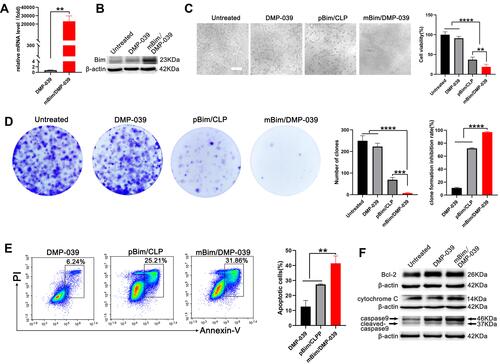
Figure 5 The mBim/DMP-039 complex inhibited abdominal cavity metastatic tumor growth in vivo. (A) Images of representative mice from each treatment group. Tumor nodules (partial) are indicated by white arrows. (B) Tumor nodules harvested from each group. (C) The average number of tumor nodules in each group (**P < 0.01). (D) The average tumor weight in each group (*P < 0.05). (E) The tumor growth inhibition rate in each group (*P < 0.05). (F) The body weights of mice from each group before euthanasia. (G) Immunohistochemical evaluation of tumor tissues from each group and H&E analysis of main organ tissues from the mBim/DMP-039 complex group (scale bars: 50 μm).
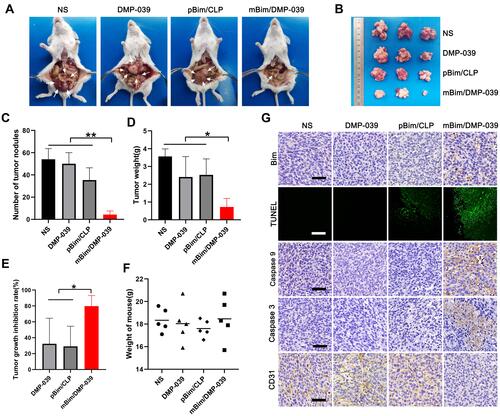
Figure 6 H&E analysis in vivo. (A) H&E analysis of the main organ tissues in the C26 abdominal cavity metastatic model (scale bars: 50 μm). (B) H&E analysis of the main organ tissues in the C26 subcutaneous xenograft model (scale bars: 50 μm).
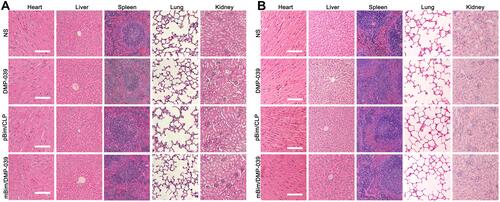
Figure 7 The mBim/DMP-039 complex suppressing the C26 subcutaneous xenograft model in vivo. (A) Tumors collected from each group. (B) Tumor growth curves from each treatment group (*P < 0.05, **P < 0.01). (C) Average tumor weights (*P < 0.05, **P < 0.01, ***P < 0.001). (D) Immunohistochemical evaluation of tumor tissue (scale bars: 50 μm). (E) H&E analysis of the main organs from the mBim DMP-039 complex group (scale bars: 50 μm).
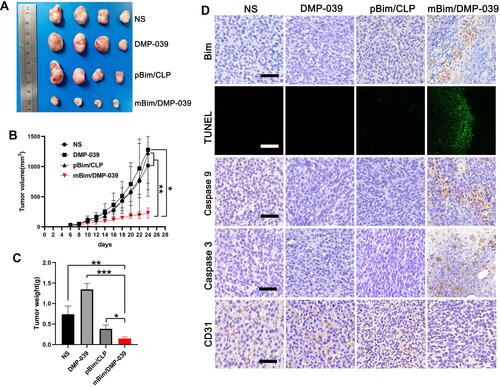
Figure 8 (A) In vivo distribution study of the DMP-039 nanoparticles upon intravenous injection; the fluorescence intensities were detected and calculated. (B) The degradation and metabolic behaviors of the DMP-039 nanoparticles upon intravenous injection. Urine samples were analyzed by HPLC-MS.
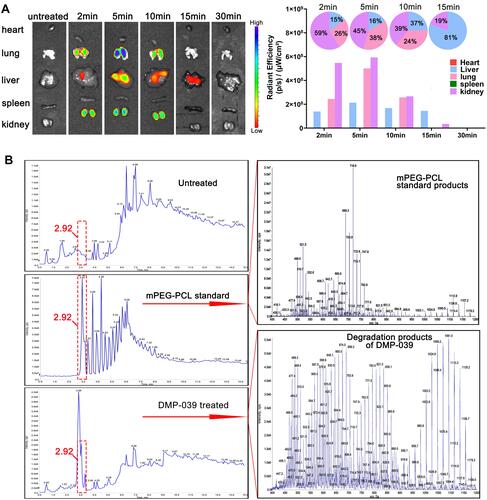
Figure 9 Therapeutic effect of the mBim/DMP-039 complex on the C26 pulmonary metastases model upon systemic administration. (A) Representative lung tissues harvested from each group. (B) H&E analysis of lung tissues using a whole lung view (scale bars: 2 mm) and partially enlarged view (scale bars: 50 μm). (C) Average tumor mass area rate for each group (**P < 0.01, ***P < 0.001). (D) Average weight of lungs (*P < 0.05, **P < 0.01). (E) Tumor growth inhibition rate for each group (*P < 0.05, **P < 0.01). (F) Immunohistochemical evaluation of tumor tissues from each group and H&E analysis of the main organ tissues from the mBim/DMP-039 complex group (scale bars: 50 μm).
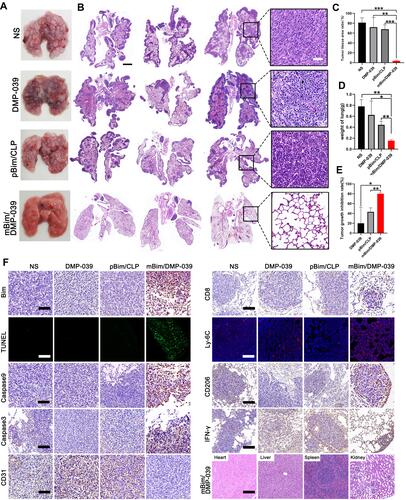
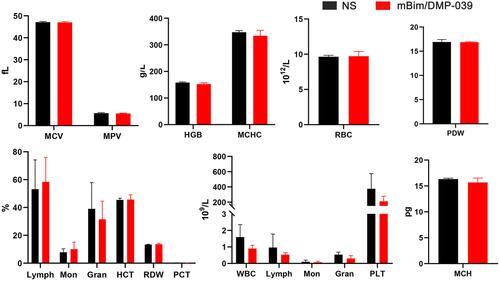
Figure 10 Blood routine analysis of mBim/DMP-039 complex-treated mice after intravenous administration.
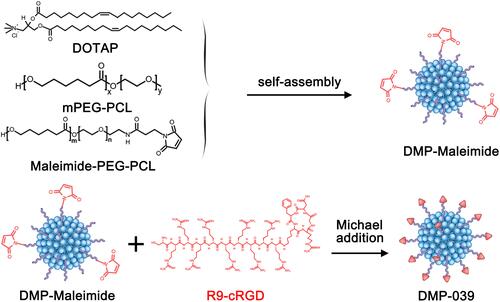
Scheme 1 The synthesis process for DMP-039 nanoparticles.
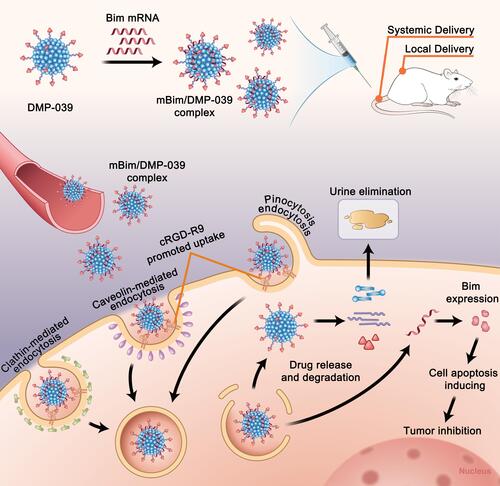
Scheme 2 A schematic view of the formulation and therapeutic processes of the mBim/DMP-039 complex.