Figures & data

Table 1 23 Full Factorial Design Levels and Independent Variables
Table 2 Formulations and CQAs Values of CTX-Loaded NPs as Claimed by 23 Full Factorial Design
Figure 1 Contour plots elucidating the effect of the independent variables (CH concentration (XA) and SH concentration (XB)) on PS (A and B) and % EE (C and D) at the minimum and maximum levels of CTX concentration (XC), respectively.
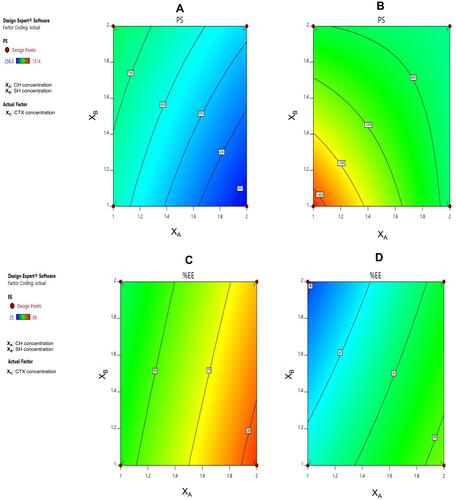
Figure 2 Three dimensional surface plots elucidating the effect of the independent variables (CH concentration (XA) and SH concentration (XB)) on PS (A and B) and % EE (C and D) at the minimum and maximum levels of CTX concentration (XC), respectively.
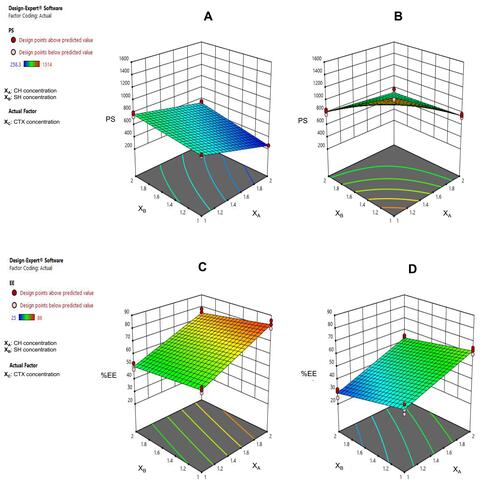
Figure 3 TEM image of F2- NPs (see for F2 composition).
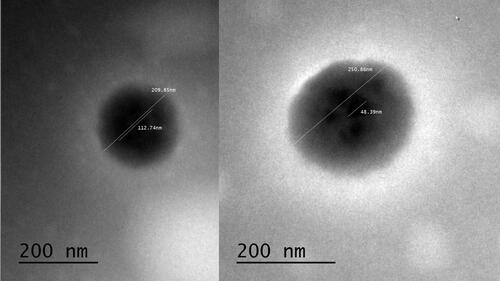
Figure 4 FT-IR spectra of (A) CTX, (B) CH, (C) SH, (D) physical mixture of CH: SH: CTX (2:1:2) and (E) F2-NPs.
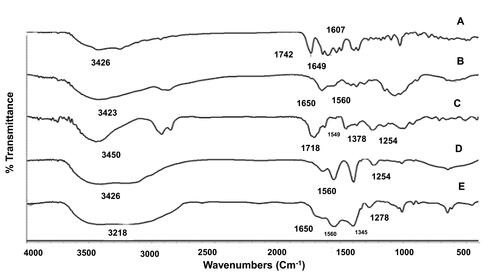
Figure 5 DSC thermograms of (A) CTX, (B) CH, (C) SH, (D) physical mixture of CH: SH: CTX (2:1:2) and (E) F2-NPs.
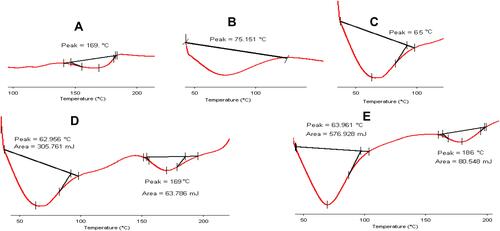
Table 3 Parameters of F2-NPs Flow Properties (See for F2 Composition)
Table 4 PS, PDI, ZP and % DC of Dry F2-NPs, Stored at Different Storage Condition (See for F2 Composition)
Figure 6 In vitro release of CTX from pure drug and F2-NPs in: (A) pH of 6.8 and (B) pH of 7.4. Each point represents the mean ± SE (n=3).
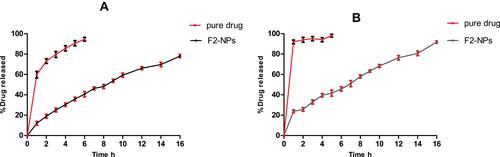
Table 5 Kinetic Analysis of the Drug Release Data of F2-NPs (See for F2 Composition)
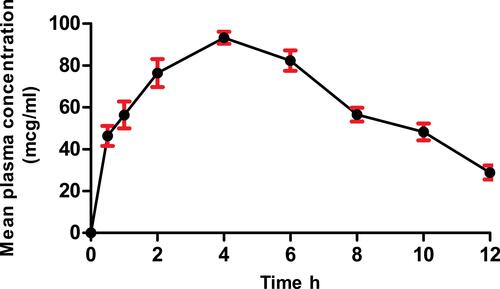
Table 6 Pharmacokinetic Parameters After Oral Administration of Enteric-Coated Hard Gelatin Capsules Loaded with F2-NPs (See for F2 Composition)
Figure 7 Mean plasma concentration-time profile in male New Zealand white rabbits after oral administration of the enteric-coated HGCs loaded with F2-NPs equals to 50 mg of CTX. Each point represents the mean ± SE (n=6).