Figures & data
Table 1 Experimental Runs, Independent Variables, and Measured Responses of the 31×41 Full Factorial Experimental Design of Epl-loaded MNLCs
Figure 1 (I) Procedural steps for preparing the hen’s egg on chorioallantoic membrane test (A–D). The egg was candled to check embryo viability (A) the air space marked (B), the external shell removed (C), and the inner membrane removed (D); (II) the observed responses to different systems application (E–H). Negative control (0.9% NaCl) (E); positive control (10% NaOH) (F); Epl aqueous suspension (G); Epl- loaded COSL-MNLCs (H); Epl loaded HA-MNLCs (I).
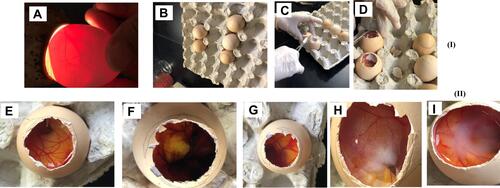
Table 2 Independent Variables, their Levels, and Summary Statistics of the 31×41 Full Factorial Design Used for Optimization of Epl-loaded MNLCs
Figure 2 Line plots of significant effects of type of surface modifier and its concentration on (A) PS, (B) PDI, (C) ZP, (D) EE%, and (E) viscosity.
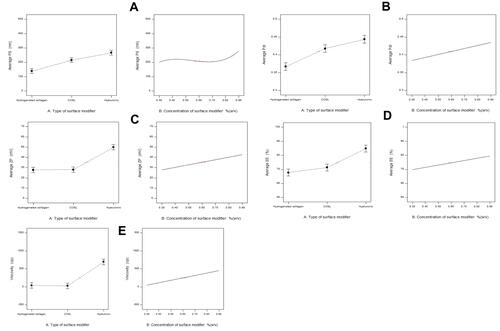
Table 3 Predicted Values of Responses for Optimized Systems (Epl-loaded HA-MNLCs and Epl-loaded COSL-MNLCs) Compared to Actual Values, along with Prediction Intervals
Figure 3 Cumulative release profile of Epl from loaded unmodified NLC system, Epl loaded HA-MNLCs and Epl loaded COSL-MNLCs.
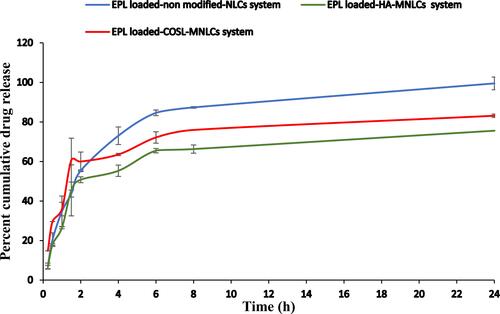
Figure 4 Mucoadhesion results: (A) PS measurements; (B) ZP measurements.
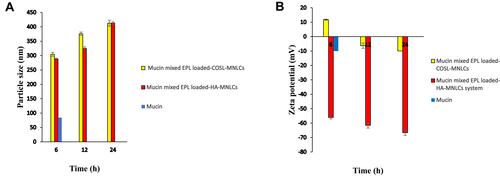
Figure 5 Transmission electron microscopy: (A) Epl loaded HA-MNLCs; (B) Epl loaded COSL-MNLCs.
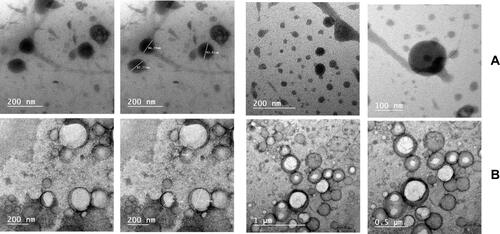
Figure 6 Photographs showing normal rabbit eyes after instillation of 0.1 mL physiological saline in a control eye, Epl loaded HA-MNLCs, and Epl loadedCOSL-MNLCs (instillation repeated every hour for 6 hours).
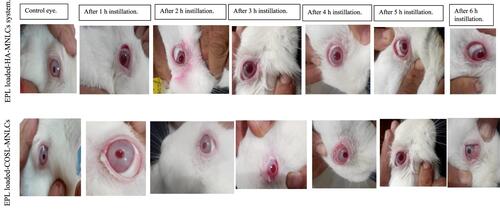
Figure 7 Histopathological stained sections (hematoxylin and eosin) of normal untreated rabbit eyes (a1–c1)and rabbit eyes treated with Epl loaded HA-MNLCs (a2–c2) and Epl loaded COSL-MNLCs (a3–c3), where “a” represents the outer layer of the cornea, “b” the irisand ciliary process, and “c” the retina, choroid, and sclera at magnification 40×.
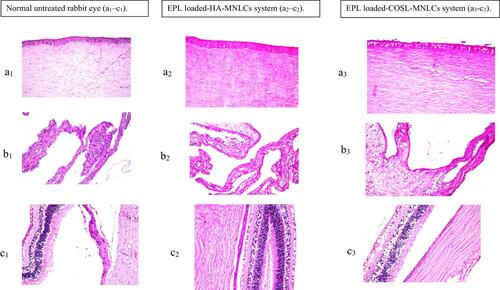
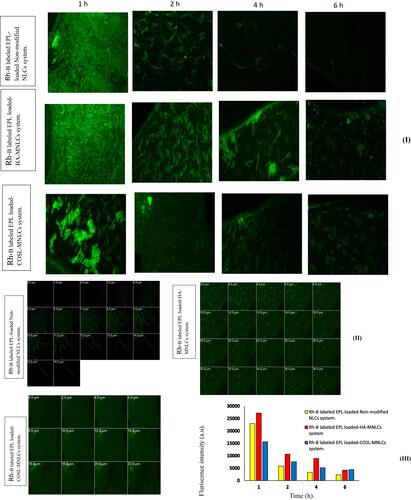
Figure 8 (I) Confocal laser-scanning microscopy of rabbit eyes at the corneal and scleral surfaces for RhB-labeled Epl-loaded unmodified NLCs, RhB-labeled Epl loaded HA-MNLCs, and RhB-labeled Epl loaded COSL-MNLCs; (II) confocal laser-scanning microscopy of rabbit corneas showing the depth of RhB; (III) mean fluorescence intensity of RhB-labeled Epl-loaded unmodified NLCs, RhB labeled Epl loaded HA-MNLCs, and RhB-labeled Epl loaded COSL-MNLCs at the time points indicated on the bar graph.