Figures & data
Figure 1 Synthesis scheme for SV119-PEG3500-DOA.
Abbreviations: DOA, dioleyl amido aspartic acid; PEG, polyethylene glycol.
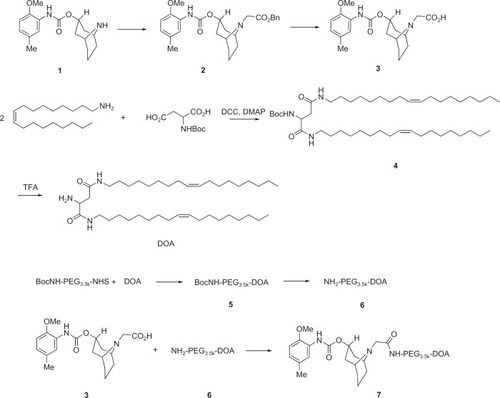
Figure 2 NMR spectrum (A) and MALDI-TOF mass spectrum (B) of SV119-PEG3500-DOA. The peaks in (A) are attributed to the benzene groups on SV119 (a), the double bonds of DOA (b), and the carbon chains of DOA (c).
Abbreviations: DOA, dioleyl amido aspartic acid; MALDI-TOF, matrix-assisted laser desorption/ionisation-time of flight; NMR, nuclear magnetic resonance; PEG, polyethylene glycol.
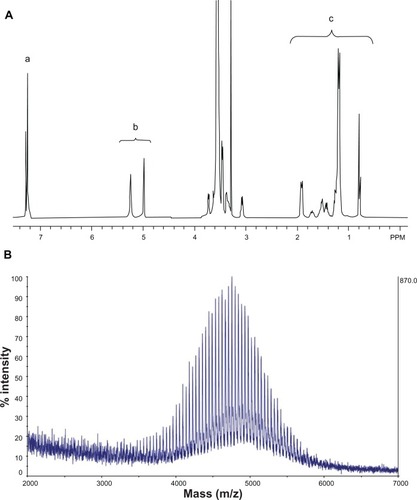
Table 1 Size and zeta potential of SV119 liposomes
Figure 3 Enhanced intracellular uptake of SV119 liposomes by DU-145 cells, examined by microscopic study (A) and quantitative analysis (B) (n = 4, mean ± SD). In (A), the percentage of SV119-PEG-DOA in the total lipid was 0% (a), 1% (b), 3% (c), and 5% (d), respectively.
Abbreviations: DOA, dioleyl amido aspartic acid; PEG, polyethylene glycol.
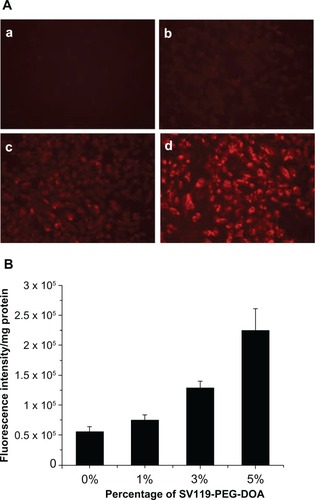
Figure 4 Cellular uptake of liposomes by BEAS-2B cells. Microscopic images (A), and quantitative analysis (B) (n = 4, mean ± SD). The percentage of SV119-PEG-DOA in the total lipid was 0% (a), or 3% (b).
Abbreviations: DOA, dioleyl amido aspartic acid; PEG, polyethylene glycol.
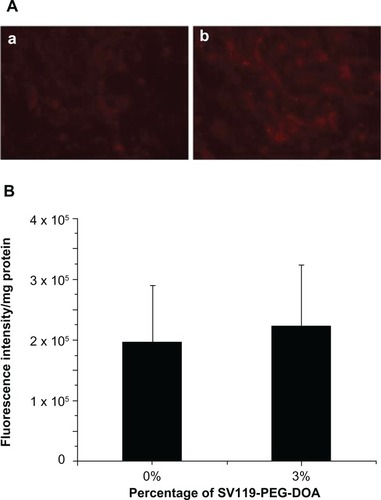
Figure 5 Uptake of SV119 liposomes by MCF-7 (A), PC-3 (B), 201T (C), and A549 cells (D) (n = 4, mean ± SD).
Abbreviations: DOA, dioleyl amido aspartic acid; PEG, polyethylene glycol.
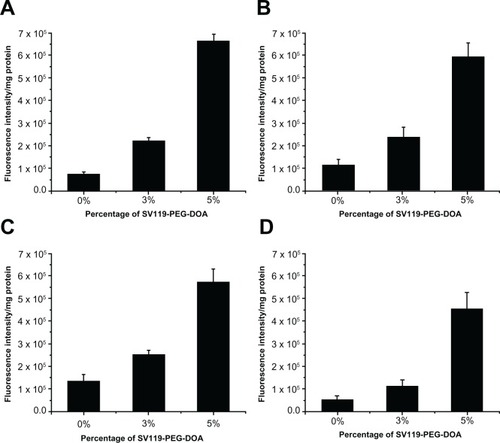
Figure 6 Time-course of cellular uptake for SV119 liposomes.
Notes: Rhodamine-PE labeled liposomes with 0% or 3% SV119-PEG-DOA were incubated with DU-145 cells for an indicated period at 37°C. (n = 4, mean ± SD).
Abbreviations: DOA, dioleyl amido aspartic acid; PEG, polyethylene glycol.
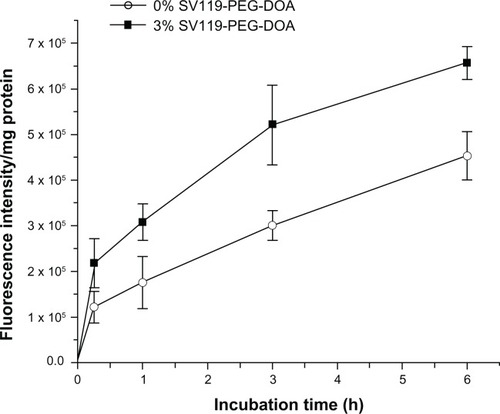
Figure 7 Uptake of liposomes decorated with modified SV119 (mSV119) by DU-145 cells. Scheme of synthesis (A) and microscopic images (B) (n = 4, mean ± SD). In (B), the percentage of mSV119-PEG-DOA in the total lipid was 0% (a), 1% (b), 3% (c), and 5% (d), respectively.
Abbreviations: DOA, dioleyl amido aspartic acid; PEG, polyethylene glycol.
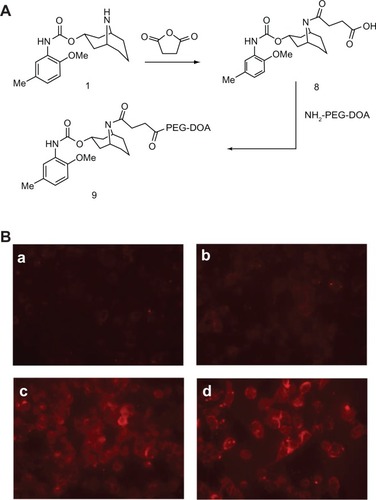
Figure 8 Cytotoxic effect of free and liposomal DOX on DU-145 prostate cancer cells. Cells were treated with free DOX, DOX-loaded SV119 liposomes or DOX-loaded unmodified liposomes with DOX concentrations of 0.2, 1, or 10 μg/mL. Cytotoxicity was assessed by MTT assay. Cells receiving no treatment were defined as the maximal cell viability. Values presented are the mean ± SD of six replicates.
Note: *P < 0.05 compared to the control treatments with unmodified liposomes.
Abbreviations: DOX, doxorubicin; L[D], DOX-loaded unmodified liposomes.
![Figure 8 Cytotoxic effect of free and liposomal DOX on DU-145 prostate cancer cells. Cells were treated with free DOX, DOX-loaded SV119 liposomes or DOX-loaded unmodified liposomes with DOX concentrations of 0.2, 1, or 10 μg/mL. Cytotoxicity was assessed by MTT assay. Cells receiving no treatment were defined as the maximal cell viability. Values presented are the mean ± SD of six replicates.Note: *P < 0.05 compared to the control treatments with unmodified liposomes.Abbreviations: DOX, doxorubicin; L[D], DOX-loaded unmodified liposomes.](/cms/asset/2b001240-59fa-40ab-a57b-e3cf49d4724c/dijn_a_31981_f0008_b.jpg)
Figure 9 Localization of SV119 liposomes in DU-145 cells. Cells were incubated with rhodamine-PE labeled SV119 liposomes for 3 hours (A–C) or 16 hours (D–F) in a serum-free medium, stained with markers of early endosomes (anti-EEA1; A–C) or lysosomes (LysoTracker®; Life Technologies, Carlsbad, CA) (D–F), and imaged using confocal microscopy. Red fluorescence represents rhodamine-PE labeled liposomes (A and D), green fluorescence represents early endosomes B) or lysosomes (E). Yellow color observed in the red + green overlay (C and F) indicates colocalization of red liposomes with the green endosomes (C) or lysosomes (F).
Note: Scale bar = 10 μm.
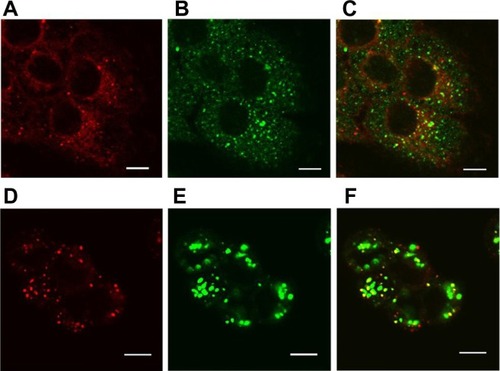
Figure S1 Scheme of synthesis for SV119-PEG550 (A) and effect of SV119 on the uptake of SV119-liposomes by DU-145 cells (B).
Abbreviation: PEG, polyethylene glycol.
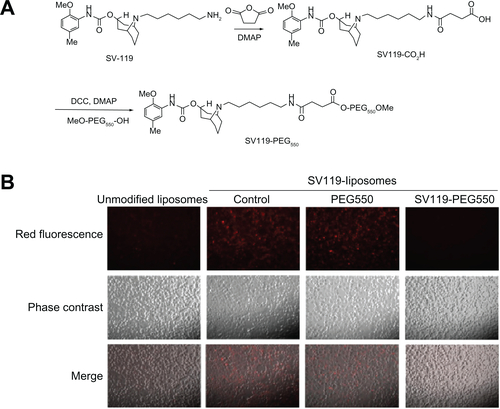
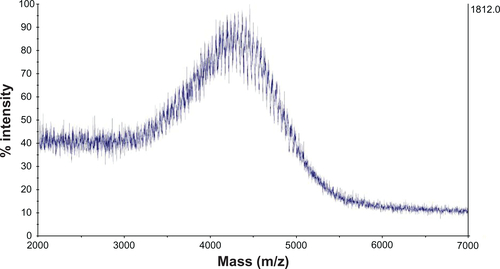
Figure S2 MALDI-TOF mass spectrometry of PEG3500.
Abbreviations: MALDI-TOF, matrix-assisted laser desorption/ionisation-time of flight; PEG, polyethylene glycol.
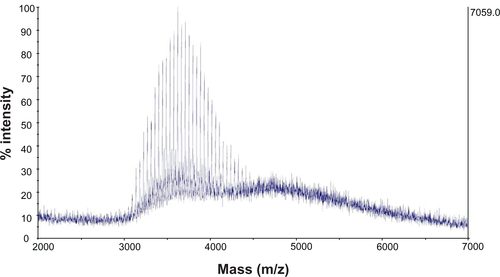
Figure S3 MALDI-TOF mass spectrometry of PEG3500-DOA.
Abbreviations: DOA, dioleyl amido aspartic acid; MALDI-TOF, matrix-assisted laser desorption/ionisation-time of flight; PEG, polyethylene glycol.