Figures & data
Figure 1 Encapsulation of bovine serum albumin Texas red conjugate (TR-BSA) in polymeric microstructures shows uniform distribution. Uniformly distributed TR-BSA in (A) microneedle backing and (B) microneedle shaft (C) microneedle array. Quantitative estimation of fluorescence intensity shows uniform distribution over (D) different areas of the backing layer (n = 3), (E) different length on a microneedle shaft (n = 6) and (F) different microneedles of an array.
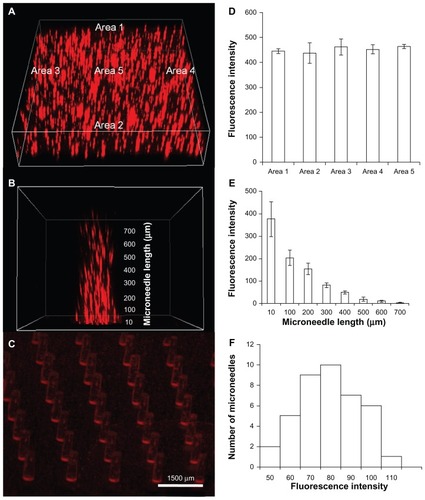
Figure 2 Sodium dodecyl sulphate-polyacrylamide gel electrophoresis images of protein standard marker, bovine serum albumin standard and bovine serum albumin released from microneedles after 24, 48, and 72 hours.
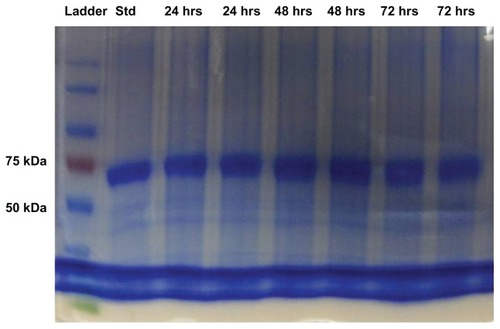
Figure 3 Circular dichroism analysis to assess the stability of encapsulated bovine serum albumin (BSA). Stability of BSA released from microneedles after storage for 3 days at 37°C is compared with a freshly prepared BSA solution and BSA degraded by heating at 75°C and under acidic conditions, pH 2 (A) mean residue ellipticity and (B) percentage of alpha-helix. All results confirmed the alpha helix structure of BSA was preserved during encapsulation and release over a period of 3 days.
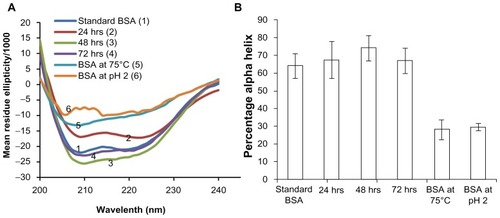
Figure 4 Fluorescence spectroscopic analysis to assess the tertiary structure of encapsulated bovine serum albumin (BSA). Stability of BSA released from microneedles after storage for 1–3 days at 37°C is compared with freshly prepared BSA solution and BSA degraded by heating at 75°C and under acidic conditions, (pH2) by analyzing the emission spectra of BSA. Peak BSA emission wavelength was found to be similar for all samples. No fluorescence was observed in degraded BSA samples.

Figure 5 Release profile of bovine serum albumin encapsulated in microneedles over a period of 6 hours. (A) Percentage amount and (B) cumulative amount released.
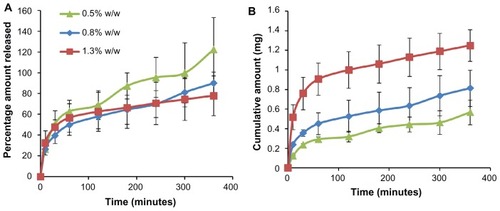
Figure 6 In vitro permeation through rat skin. (A) Percentage amount and (B) cumulative amount permeated through rat skin when applied with a microneedle patch (containing 0.71%–1.85% w/w bovine serum albumin) or a propylene glycol solution of bovine serum albumin over a period of 48 hours.
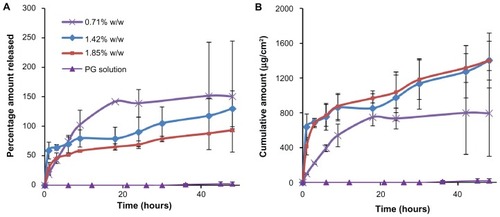
Figure 7 In vitro biocompatibility testing using MTT assay in (A) human dermal fibroblasts (HDF), (B) human adult low calcium high temperature (HaCaT) cells, and (C) human embryonic kidney 293 (HEK293) cells demonstrated high cell viability, indicating the biocompatibility of polymerized PEGDA microneedles.
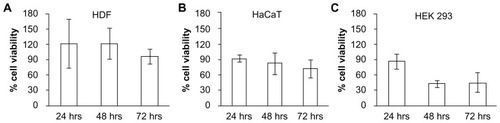
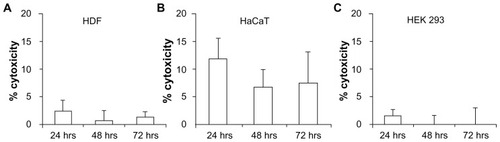
Figure 8 In vitro cytotoxicity testing using lactate dehydrogenase assay in (A) human dermal fibroblasts (HDF), (B) human adult low calcium high temperature (HaCaT) cells, and (C) human embryonic kidney 293 (HEK293) cells demonstrated low toxicity, indicating the biocompatibility of PEGDA microneedles.