Figures & data
Table 1 Sulfation Conditions and Chemical Properties of Original and Sulfated P. yezoensis Polysaccharides
Figure 1 Schematic diagram of sulfation reaction and chemical properties characterization of PYPs before and after sulfation. (A) Schematic diagram of sulfation reaction; (B) FT-IR spectra; (C) 1H NMR spectra; (D) 13C NMR spectra.
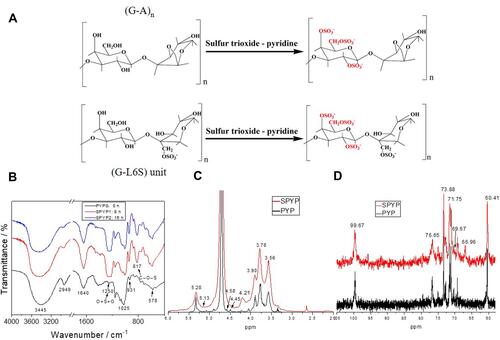
Table 2 The 13C NMR Chemical Shift Data of PYP Before and After Sulfation
Figure 2 Changes of viability (A) and morphologies (B) of damaged cells before and after repair by PYPs with different –OSO3– content. Polysaccharide concentration: 20, 40, 60, and 100 μg/mL; oxalate concentration: 2.6 mmol/L: injury time: 3.5 h; repair time: 12 h. Compared with DC group, **P<0.01. Scale bars: 20 μm.
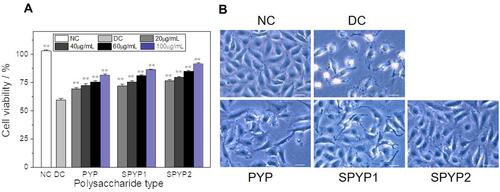
Figure 3 Intracellular ROS expression of damaged cells before and after repair by PYPs with different –OSO3– content. (A) Fluorescence microscopy images; (B) quantitative histogram of fluorescence intensity. Polysaccharide concentration: 100 μg/mL; oxalate concentration: 2.6 mmol/L: injury time: 3.5 h; repair time: 12 h. Compared with DC group, **P<0.01. Scale bars: 50 μm.
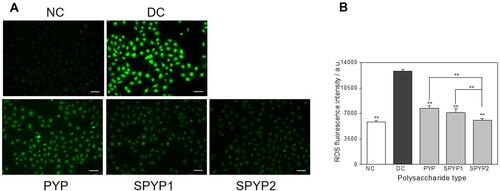
Figure 4 Changes of intracellular Ca2+ levels of damaged cells before and after repair by PYPs with different –OSO3– content. (A) Fluorescence microscopy images; (B) quantitative histogram of fluorescenceintensity. Polysaccharide concentration: 100 μg/mL; oxalate concentration: 2.6 mmol/L: injury time: 3.5 h; repair time: 12 h. Compared with DC group, *P<0.05; **P<0.01. Scale bars: 20 μm.
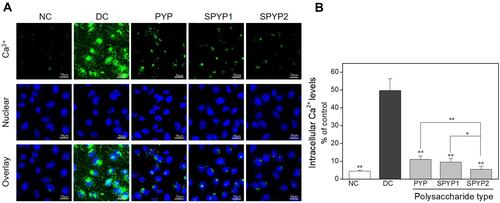
Figure 5 Changes of cell mitochondrial membrane potential of damaged cells before and after repair by PYPs with different –OSO3– content. (A) Fluorescence microscopy images; (B) flow cytometry results; (C) quantitative histogram of red fluorescence intensity; (D) quantitative histogram of green fluorescence intensity. Polysaccharide concentration: 100 μg/mL; oxalate concentration: 2.6 mmol/L: injury time: 3.5 h; repair time: 12 h.
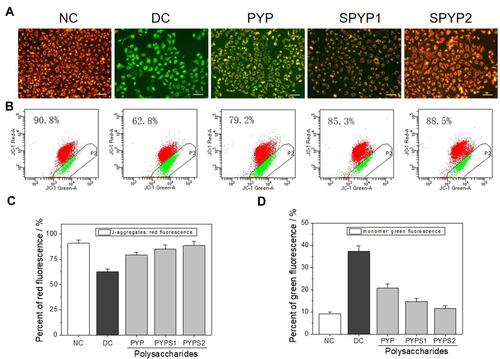
Figure 6 Expression of adhesion proteins of damaged cells before and after repair by PYPs with different –OSO3– content. (A) Western blotting; (B) Quantitative histogram of protein expression. Polysaccharide concentration: 100 μg/mL; oxalate concentration: 2.6 mmol/L: injury time: 3.5 h; repair time: 12 h.
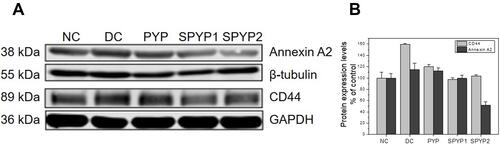
Figure 7 Adhesion of nano-COM crystals on damaged cells before and after repair by PYPs with different –OSO3– content. (A) SEM observation; (B) quantitative detection of the proportion of cells with adhered FITC-labeled nano-COM crystals by flow cytometry; (C) statistical results of the proportion of cells with adhered crystals. Polysaccharide concentration: 100 μg/mL; oxalate concentration: 2.6 mmol/L: injury time: 3.5 h; repair time: 12 h. Compared with DC group, *P<0.05; **P<0.01.
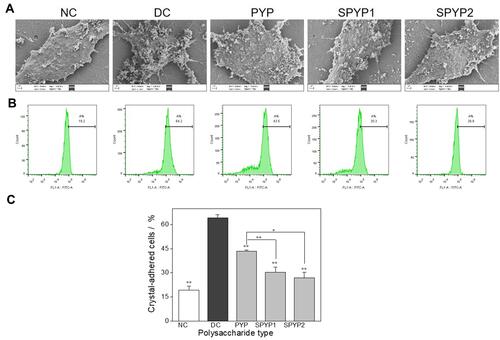
Figure 8 Accumulation of nano-COM crystals in lysosome of damaged cells before and after repair by PYPs with different –OSO3– content. (A) Laser confocal observation; (B) quantitative detection of the proportion of cells with endocytosed crystals by flow cytometry; (C) statistical results of the proportion of cells with endocytosed crystals. Cells were treated with FITC-labeled 200 μg/mL COM crystals (green fluorescence) for 6 h; lysosomes were stained with Lyso-Tracker Red (red fluorescence); cell nuclei were stained with DAPI (blue fluorescence). Polysaccharide concentration: 100 μg/mL; oxalate concentration: 2.6 mmol/L: injury time: 3.5 h; repair time: 12 h. Compared with DC group, **P<0.01. Scale: 20 μm.
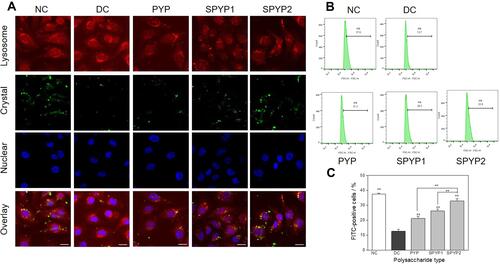
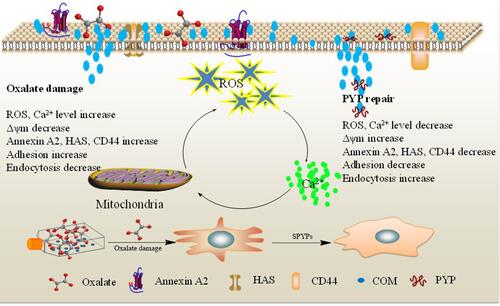
Figure 9 Mechanism of adhesion and endocytosis of nano-COM crystals in damaged HK-2 cells before and after repair by PYPs with different –OSO3– content.