Figures & data
Figure 1 Effects of MAA-coated CdSe QDs on the plasmid DNA. (A) Electrophoresis in 1% agarose gel of pUC18 DNA (150 ng per sample) incubated for 2 hours at 4°C in the dark with QDs. Lane 1: pUC18 DNA only; lanes 2–6: pUC18 DNA incubated with different concentrations of QDs (3.6, 1.2, 0.4, 0.13, 0.043 μmol/L). (B) DNA quality of plasmids pUC18 incubated with different concentrations of QDs (3.6, 1.2, 0.4, 0.13, 0.043 μmol/L) for 2 hours at 4°C in the dark was tested by transformation with Escherichia coli strain DH5α. (C) Scanning densitometry results of three replicate experiments for each sample, with the error bars representing the standard deviations.
Abbreviations: OC, opened circular; CCC, covalently closed circular; MAA, mercaptoacetic acid; QDs, quantum dots.
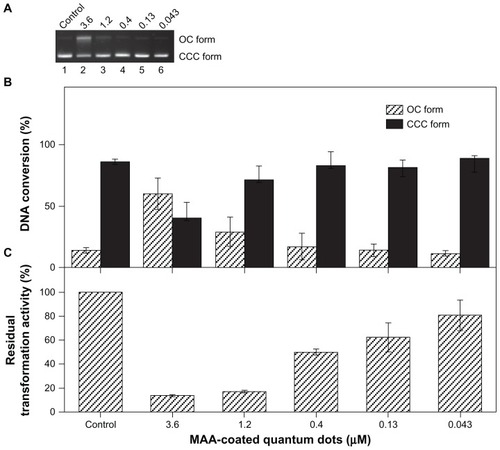
Figure 2 Effects of different nanoparticles on the transformablities of plasmid DNA.
Notes: DNA qualities of plasmids pUC18 incubated with nano-TiO2 (1.5 mg/mL), fullerenes (1.5 mg/mL), MAA–QDs (3.6 μmol/L) and OPA-QDs (3 μmol/L) for 2 hours at 4°C in the dark were tested by transformation with Escherichia coli strain DH5α. There is no significant difference between the incubated and non-incubated plasmids in transformation activity when plasmids were incubated with nano-TiO2, fullerenes, and OPA-QDs (P > 0.05), respectively.
Abbreviations: MAA-QDs, mercaptoacetic acid-coated quantum dots; OPA-QDs, octylamine-modified polyacrylic acid-coated quantum dots.

Figure 3 Effect of Cd2+ or MAA on the configuration of plasmid DNA.
Notes: Electrophoresis in 1% agarose gel of pUC18 DNA (150 ng per sample) incubated for 12 hours at 4°C in the dark with increasing concentrations of Cd2+ or with increasing concentrations of MAA. Lane 1: pUC18 DNA only; lane 2: pUC18 DNA digested by Hind III; lanes 3–6: pUC18 DNA incubated with 0.5, 5, 50, 500 μmol/L Cd ions; lanes 7–10: pUC18 DNA incubated with 0.05, 0.5, 5, 50 mmol/L MAA. DNA smear caused by MAA was observed in lanes 8–10, and the pUC18 plasmid DNA in lane 10 was completely degraded by MAA.
Abbreviations: OC, opened circular; CCC, covalently closed circular; MAA, mercaptoacetic acid.
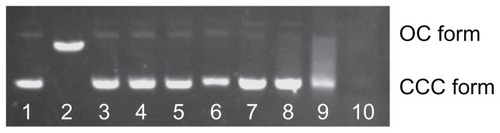
Figure 4 Co-effect of Cd2+ and MAA on the configuration of plasmid DNA. (A) Electrophoresis in 1% agarose gel of pUC18 DNA (150 ng per sample) incubated with Cd2+ in the presence of increasing MAA concentrations for 12 hours at 4°C in the dark. Lane 1: pUC18 DNA only; lane 2: pUC18 DNA digested by Hind III; lanes 3–9: pUC18 DNA incubated with mixtures of Cd2+ (500 μmol/L) and 0, 5, 10, 15, 25, 35, 45 mmol/L MAA. (B) Scanning densitometry results of three replicate experiments for each sample, with the error bars representing the standard deviations.
Abbreviations: OC, opened circular; CCC, covalently closed circular; MAA, mercaptoacetic acid.
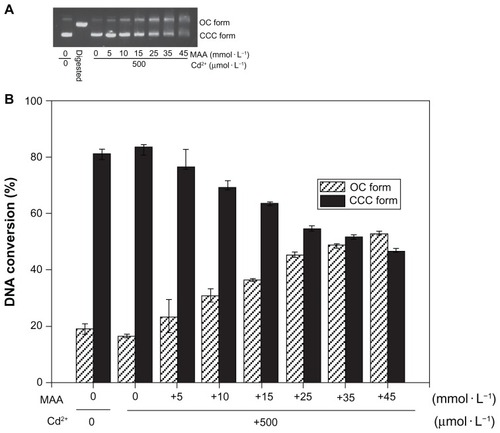
Figure 5 ESI mass spectra of Cd(SCH2COOH)2 complex. Each peak represents an ion having a specific mass-to-charge ratio (m/z), and the height of the peak indicates the relative abundance. The base peak in the mass spectrum, corresponding to the ion which has the greatest intensity, is set to 100% relative abundance. (A) The base peak at m/z 146.8 suggests the greatest intensity of Cd(SCH2COOH)2 in the mixture of Cd and MAA. (B) The base peak at m/z 146.8 suggests the greatest intensity of Cd(SCH2COOH)2 in the solution of MAA-coated CdSe QDs. Cd(SCH2COOH)2 appears to be the primary toxin as no other ions were present above 10% relative abundance in either of the solutions.
Abbreviations: ESI mass, electrospray ionization mass; MAA, mercaptoacetic acid.
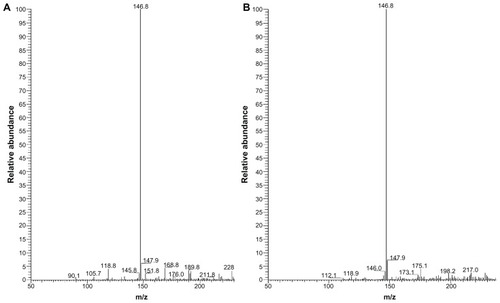
Figure 6 Competitive displacement of intercalating dye EtBr from EtBr-CT-DNA complex by the Cd–MAA complex.
Notes: Curves from top to bottom: EtBr (10 μmol/L) +CT-DNA (50 μmol/L); EtBr (10 μmol/L) +CT-DNA (50 μmol/L) +cadmium complex (10, 20, 30, 40, 50, 100, 1000 μmol/L). Fluorescence was monitored at 605 nm using an excitation wavelength of 518 nm.
Abbreviations: EtBr, ethidium bromide; CT-DNA, Calf-thymus DNA; Cd-MAA, cadmium-mercaptoacetic acid.
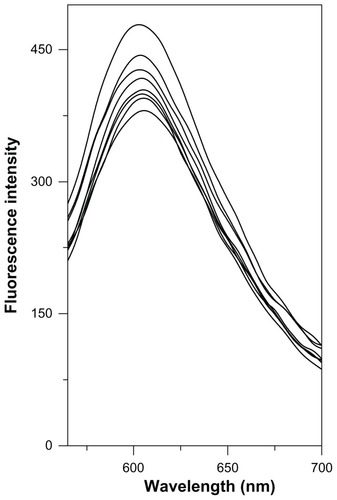
Figure 7 CD spectra of pUC18 DNA.
Notes: The interactions of pUC18 DNA with MAA and Cd–MAA were at a ratio of compound:DNA = 0.4. All the spectra were recorded in Tris-HCl buffer, pH 7.0.
Abbreviations: CD, circular dichroism; MAA, mercaptoacetic acid; Cd-MAA, cadmium-mercaptoacetic acid.
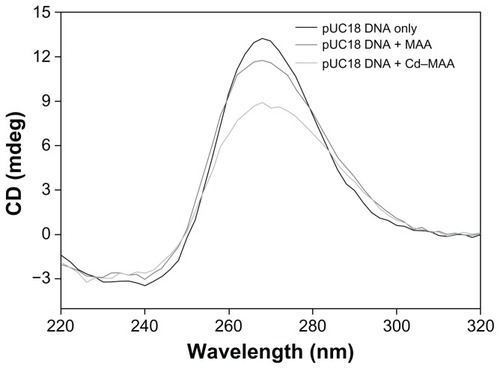
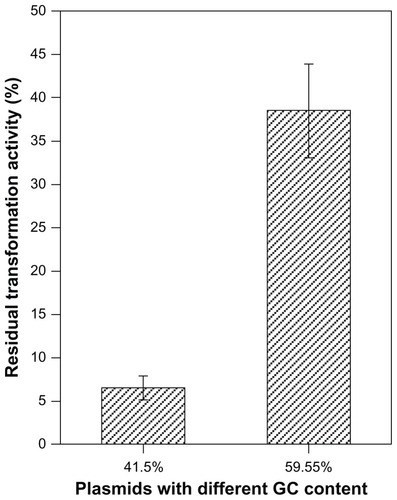
Figure 8 Effects of QDs on the plasmids with different GC contents.
Notes: Plasmids with the same size and dose but contained different GC contents (41.5%, 59.55%) and were incubated with MAA-coated CdSe QDs (3 μmol/L) for 2 hours at 4°C in the dark. P < 0.001.
Abbreviations: QDs, quantum dots; GC content, guanine + cytosine content.