Figures & data
Table 1 Effects of wollastonite nanofiber (WNF) amounts on properties of WNF-doped calcium phosphate cement (CPC) (powder-to-liquid ratio, 2.5)
Table 2 Effects of powder-to-liquid (P/L) ratio on properties of wollastonite nanofiber (WNF)–doped calcium phosphate cement with 10 wt% WNFs
Figure 1 Scanning electron microscope images of wollastonite nanofibers with different magnifications: (A) ×30000 and (B) ×60000.
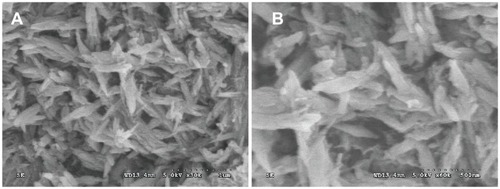
Figure 2 X-ray diffraction (A) and Fourier transform infrared spectroscopy (B) patterns of wollastonite nanofibers (WNFs), WNF-doped calcium phosphate cement (wnf-CPC) with 10 wt% WNFs, and calcium phosphate cement (CPC).
Abbreviation: HA, hydroxyapatite.
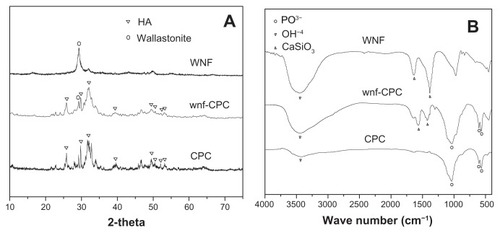
Figure 3 Scanning electron microscope images of surface morphology/microstructure of (A) wollastonite nanofiber–doped calcium phosphate cement with 10 wt% wollastonite nanofibers and (B) calcium phosphate cement.
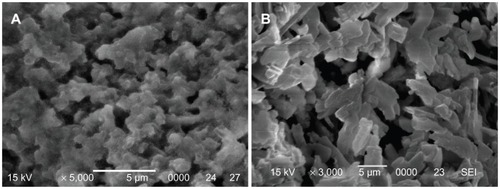
Figure 4 Weight loss ratio of wollastonite nanofiber (WNF)–doped calcium phosphate cement (wnf-CPC) and calcium phosphate cement (CPC) soaking in tris hydrochloride solution over time.
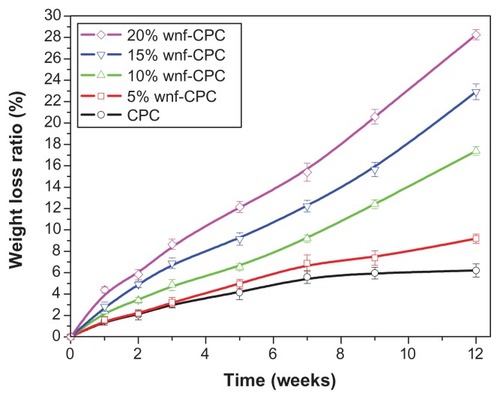
Figure 5 Changes in calcium (Ca), silicon (Si), and phosphorus (P) ion concentrations in the tris hydrochloride solution for wollastonite nanofiber–doped calcium phosphate cement with 10 wt% wollastonite nanofibers over time.
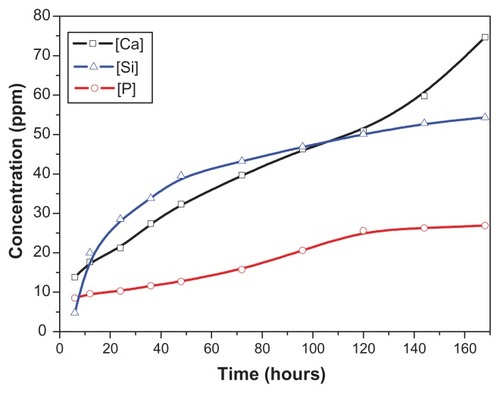
Table 3 Effects of soaking time on porosity of calcium phosphate cement (CPC) and wollastonite nanofiber–doped CPC (wnf-CPC) with 10 wt% wollastonite nanofibers (powder-to-liquid ratio, 2.5)
Figure 6 Scanning electron microscope images of surface morphology of (A) wollastonite nanofiber–doped calcium phosphate cement with 10 wt% wollastonite nanofibers and (B) calcium phosphate cement immersed in tris hydrochloride solution for 5 weeks.
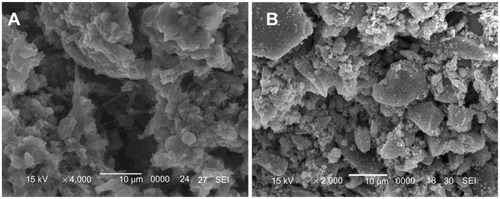
Figure 7 Methyl-thiazolyl-tetrazolium bromide assay of attachment ratio of MG-63 cells on wollastonite nanofiber (WNF)–doped calcium phosphate cement (wnf-CPC) with 10 wt% WNFs, calcium phosphate cement (CPC), and a tissue culture plate as a control after being cultured for 4 hours.
Abbreviation: OD, optical density.
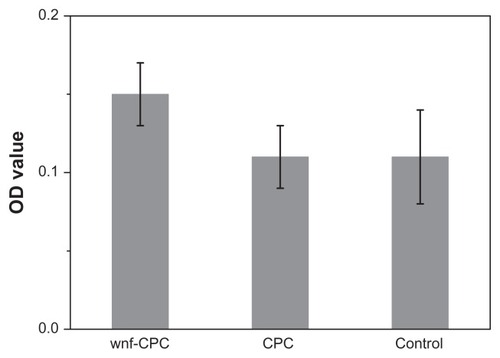
Figure 8 Methyl-thiazolyl-tetrazolium bromide assay of proliferation of MG-63 cells on wollastonite nanofiber (WNF)–doped calcium phosphate cement (wnf-CPC) with 10 wt% WNFs, calcium phosphate cement (CPC), and a tissue culture plate as a control at different times.
Abbreviation: OD, optical density.
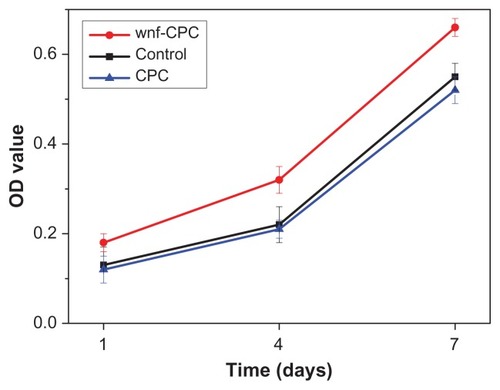
Figure 9 Morphology of cells cultured with samples for 3 days: (A) wollastonite nanofiber–doped calcium phosphate cement with 10 wt% wollastonite nanofibers and (B) calcium phosphate cement.
Notes: M represents materials; C represents cells; arrow indicates interface between materials and cells.
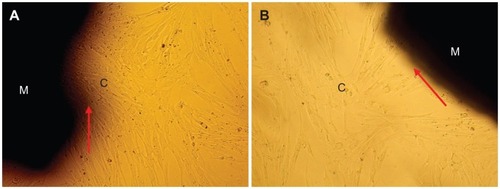
Figure 10 Scanning electron microscope images of MG-63 cells spread on (A) wollastonite nanofiber–doped calcium phosphate cement with 10 wt% wollastonite nanofibers and on (B) calcium phosphate cement samples for 3 days.
Note: Arrow indicates cells.
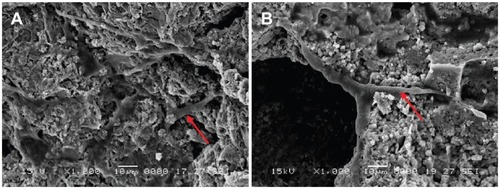
Table 4 Changes in calcium (Ca), silicon (Si), and phosphorus (P) concentrations and pH values in culture medium with time
Figure 11 Hematoxylin and eosin–stained sections (magnification, ×20) of wollastonite nanofiber–doped calcium phosphate cement with 10 wt% wollastonite nanofiber samples implanted into bone defects of rabbit femora for (A) 3, (B) 6, and (C) 12 weeks, and of (D) calcium phosphate cement implanted for 12 weeks.
Notes: B represents new bone tissues; M represents implanted materials.
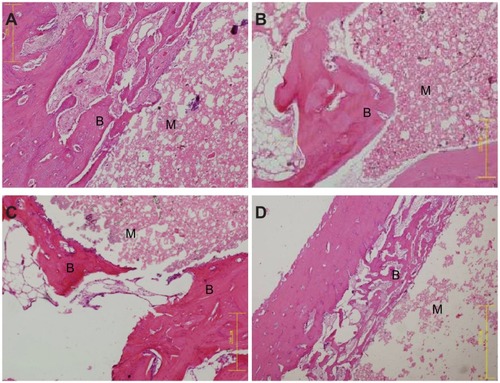
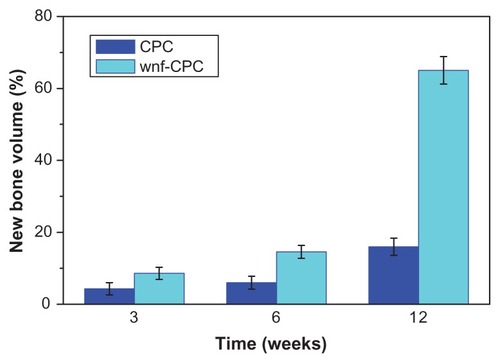
Figure 12 Histomorphometric analysis of bone defects repaired by wollastonite nanofiber–doped calcium phosphate cement (wnf-CPC) with 10 wt% wollastonite nanofibers and calcium phosphate cement (CPC) over time.
Notes: Data presented as mean plus or minus standard deviation; n = 4.