Figures & data
Figure 1 TEM (A), size distribution (B), and zeta potential (C) images of bufalin-mPEG-PLGA-PLL-cRGD NPs.
Abbreviations: NPs, nanoparticle drug delivery systems; TEM, transmission electron microscopy.
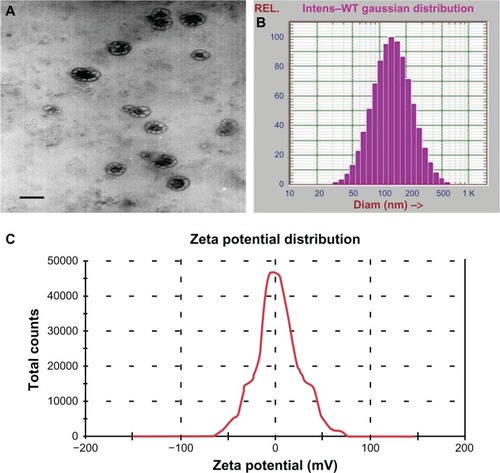
Table 1 Encapsulation efficiency and drug-loading rate of bufalin-mPEG-PLGA-PLL-cRGD NPs
Figure 2 UV spectrum of PBS, mPEG-PLGA-PLL-cRGD and bufalin.
Abbreviation: PBS, phosphate-buffered saline.
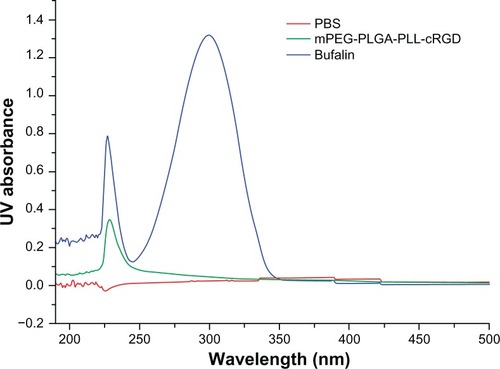
Figure 3 Drug-release profile of NPs.
Abbreviation: NPs, nanoparticle drug delivery systems.
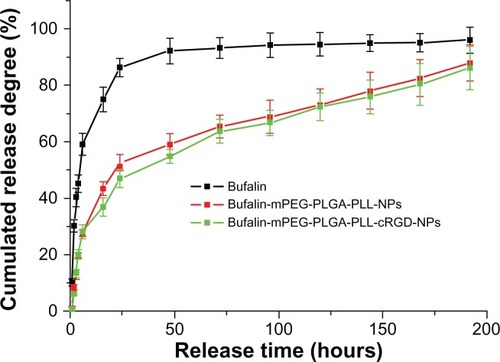
Table 2 The main pharmacokinetic parameters of compartment model estimation
Figure 4 Cellular viability of SW620 colon cancer cells after 24hours culture with free bufalin and bufalin-NPs.
Notes: *P < 0.05 when compared with bufalin; **P < 0.01 when compared with bufalin by t-test.
Abbreviation: NPs, nanoparticle drug delivery systems.
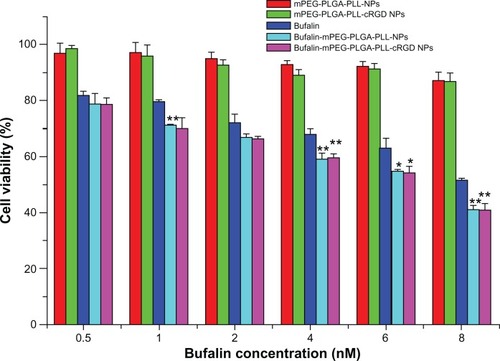
Figure 5 Confocal images of SW620 colon cancer cells and HUVECs after treatment with Rb-mPEG-PLGA-PLL NPs (A) and Rb-mPEG-PLGA-PLL-cRGD NPs (B), and confocal images of HUVECs after treatment with Rb-mPEG-PLGA-PLL NPs (C) and Rb-mPEG-PLGA-PLL-cRGD NPs (D).
Abbreviations: HUVECs, human umbilical vein endothelial cells; NPs, nanoparticle drug delivery systems; Rb, rhodamine B.
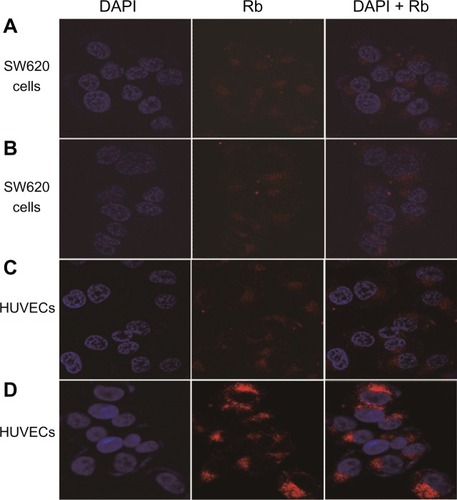
Figure 6 In vivo noninvasive targeted imaging of the tumor-bearing mice injected with Rb-mPEG-PLGA-PLL (A) and Rb-mPEG-PLGA-PLL-cRGD (B) NPs.
Notes: The colors indicate the changes in fluorescence signal intensity from high (red) to low (blue).
Abbreviations: NPs, nanoparticle drug delivery systems; Rb, rhodamine B.
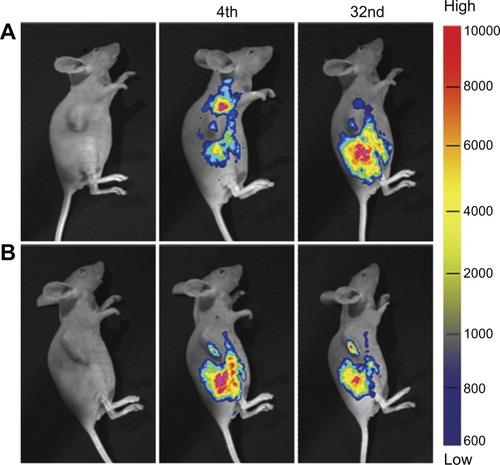
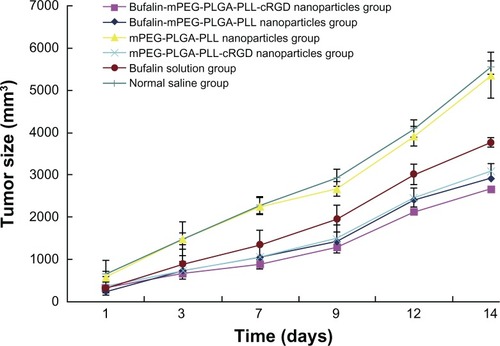
Figure 7 Tumor size in different groups (mm3; n = 10).