Figures & data
Figure 1 Schematic illustration of the fabrication process of iRGD-modified RBC membrane-coated mesoporous silica nanoparticles. (A) Synthesis of mesoporous silica nanoparticles (MSNs) and preparation of doxorubicin-loaded nanoparticles (DOX/MSNs); (B) Preparation of iRGD-inserted RBC membrane vesicles; (C) The fusion of DOX/MSNs and iRGD-RBC vesicles to prepare iRGD-RM-(DOX/MSNs).
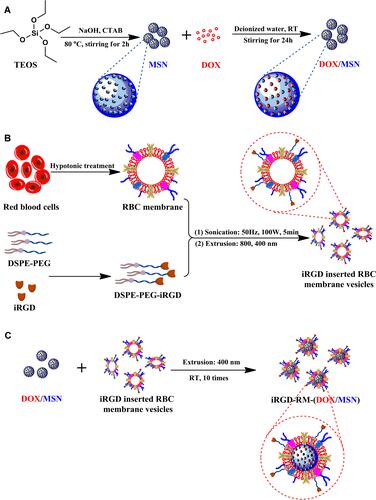
Figure 2 Characterization of mesoporous silica nanoparticles. (A) Size distribution and (B) zeta potential of MSNs; (C) N2 adsorption/desorption isotherm curves and (D) pore diameter; TEM image of MSNs, (E) and (F) at magnifications of 80k × and 120k ×, respectively. Bar = 200 nm.
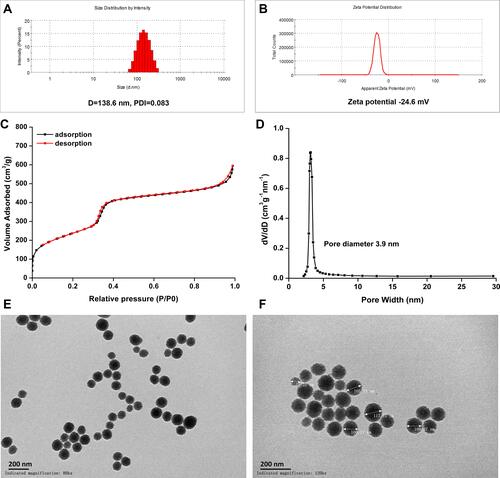
Figure 3 Preparation and characterization of RBC membrane coated mesoporous silica nanoparticles. (A) Z-average diameter and (B) zeta potential of RBC membrane vesicles or iRGD-modified RBC membrane vesicles (n=3); (C) Z-average diameter and (D) zeta potential of membrane-coated nanoparticles fabricated with varying rations of MSN weight to blood volume (n=3); TEM image of (E) RBC membrane and (F) iRGD-inserted RBC membrane-coated nanoparticles at a magnification of 80k ×, Bar = 200 nm.
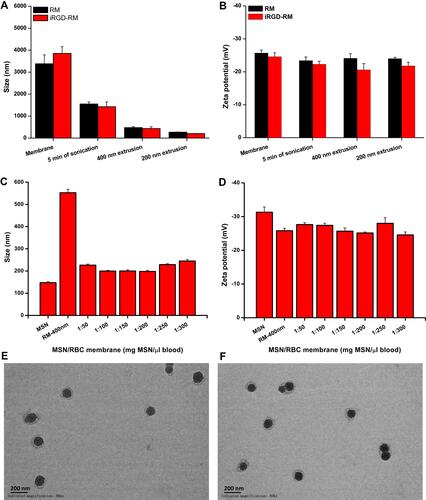
Figure 4 Preparation and characterization of RBC membrane-coated DOX-loaded mesoporous silica nanoparticles. (A) Size distribution and (B) zeta potential of the different nano-formulations; (C) color of different formulations distributed in water (a. MSNs; b. DOX/MSNs; c. RM-(DOX/MSNs); d. iRGD-RM-(DOX/MSNs)); (D) In vitro DOX release profile of different drug-loaded nanoparticles in PBS (pH 5.0 or 7.4) at 37 °C (n = 3).
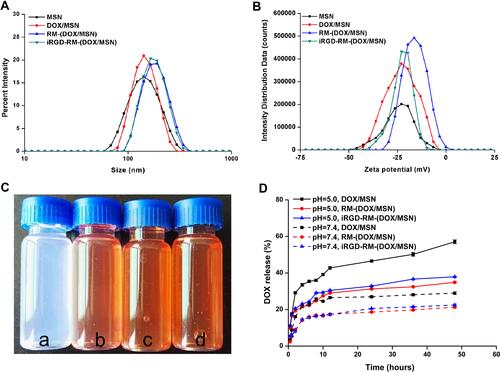
Figure 5 Hemolysis assay of MSNs, RM-MSNs and iRGD-RM-MSNs (A) Color of hemolysis at concentrations ranging from 7.8 to 1000 μg/mL. Samples were treated with water or 1x PBS as a positive and negative control, respectively. (B) Quantitative characterization of hemolysis (n=3); (C) Schematic illustration of the hemolysis assay.
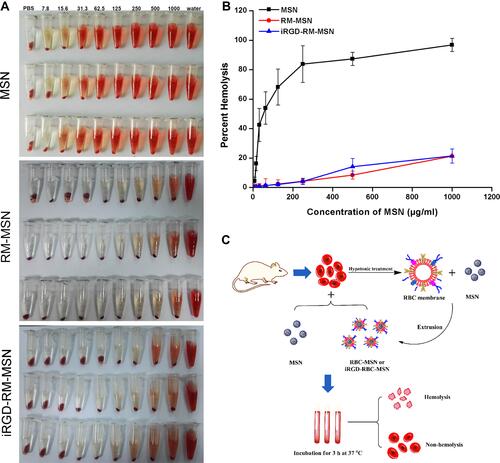
Figure 6 In vivo and acute toxicity and immunogenicity. Mice were intravenously administered a high dosage of different formulations (30 mg/kg DOX), and blood samples were collected at 12 and 24 hours after administration. (A) RBC, (B) WBC, (C) PLT, (D) MPV, (E) MCV, (F) HGB levels and (G–I) serum levels of the main proinflammatory cytokines (IL-1β, IL-6, and TNF-α). Bars are represented as SD, n.s p > 0.05, *p < 0.05, **p < 0.01 (n=3).
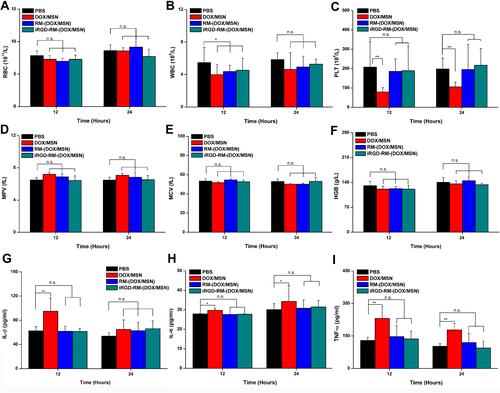
Figure 7 In vitro cellular uptake of DOX-loaded nanoparticles by RAW264.7 cells at 30 min and 1 hour after treatment. (A) Images were observed by CLSM. The nucleus and F-actin were stained with DAPI (blue) and phalloidin (green), respectively. DOX exhibits red fluorescence. (B) Flow cytometry histograms of cells treated with different formulations. (C) Quantification of the mean fluorescence intensity of the histograms in (B). **p < 0.01, the two groups were compared by independent Sample t-test (n = 3).
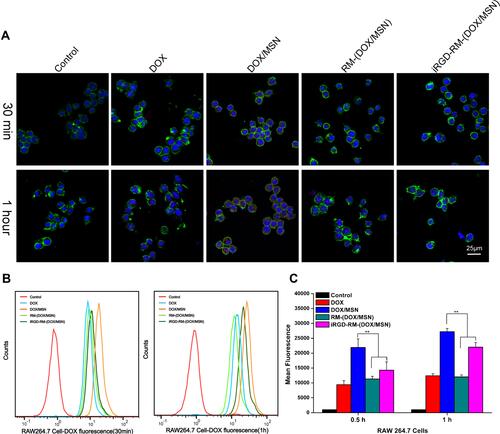
Figure 8 In vitro cellular uptake of DOX-loaded nanoparticles by MDA-MB-231 cells at 30 min and 1 hour after treatment. (A) Images were observed by CLSM. The nucleus and F-actin were stained with DAPI (blue) and phalloidin (green), respectively. DOX exhibits red fluorescence. (B) Flow cytometry histograms of cells treated with different formulations. (C) Quantification of the mean fluorescence intensity of the histograms in (B). **p < 0.01, the two groups were compared by independent Sample t-test (n = 3).
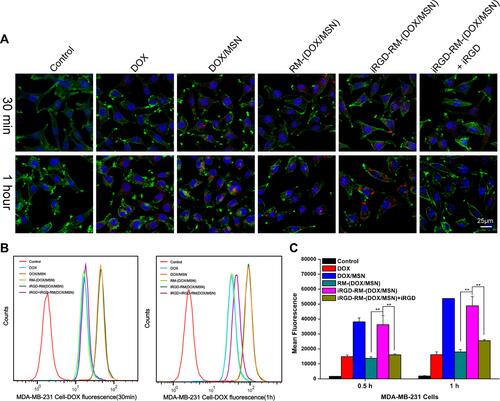
Figure 9 In vitro cytotoxicity of nanoparticles in MDA-MB-231 cells. Cell viability of (A) empty nanoparticles and (B) DOX-loaded nanoparticles in MDA-MB-231 cells at 48 h. Bars represent the SD (n = 6). (C) Representative flow cytometric patterns and (D) quantitative analysis of apoptosis by flow-cytometric analysis. MDA-MB-231 cells were treated with free DOX, DOX/MSNs, RM-(DOX/MSNs), iRGD-RM-(DOX/MSNs) and iRGD-RM-(DOX/MSNs) with free iRGD for 48 h at a DOX concentration of 10 μg/mL. ap < 0.001 vs DOX; bp < 0.01 vs DOX/MSN; cp < 0.001 vs RM-(DOX/MSN); dp < 0.01 vs iRGD-RM-(DOX/MSN) (n = 3).
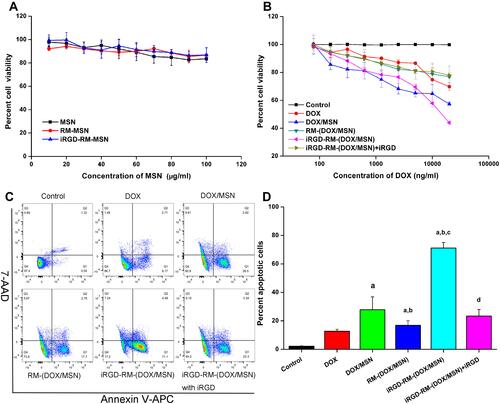
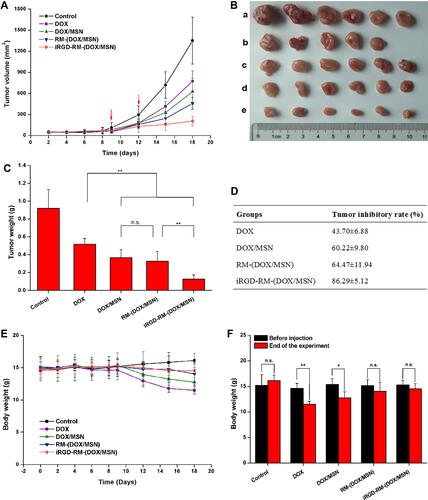
Figure 10 In vivo antitumor activity. (A) Tumor growth curves showing changes in the tumor volume. (B) Images of excised tumors (a control, b DOX, c DOX/MSN, d RM-(DOX/MSN), e iRGD-RM-(DOX/MSN)) and (C) tumor weight at the end of the experiment. (D) Tumor growth inhibition rate as calculated with the excised tumor weight. (E) Alterations in total body weight of tumor-bearing mice after treatment with different nanoparticle formulations. (F) Comparison of body weight before nanoparticle treatment and at the end of the test. Bars are represented as the SD, n.s p > 0.05, *p < 0.05, **p < 0.01 (n=6).