Figures & data
Figure 1 The surface appearance of the CoCrMo alloy after coating. (A) CoCrMo; (B) CoCrMo/GO, (C) CoCrMo/ε-PLL, and (D) CoCrMo/GO/ε-PLL.
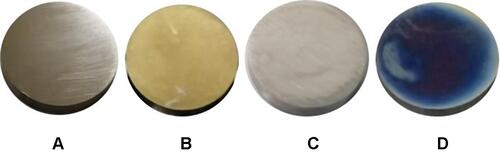
Figure 2 Orthogonal experimental results. (A) ε-PLL coating under different parameters (E1-E16). (B) GO and ε-PLL composite coating under different parameters (Ep 1-Ep 16).
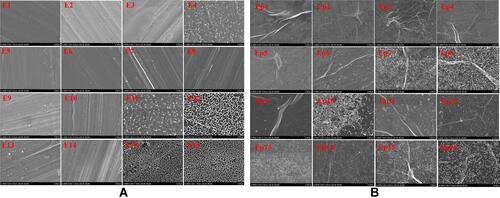
Figure 3 SEM observation of CoCrMo, CoCrMo/GO, CoCrMo/ε-PLL, and CoCrMo/GO/ε-PLL.
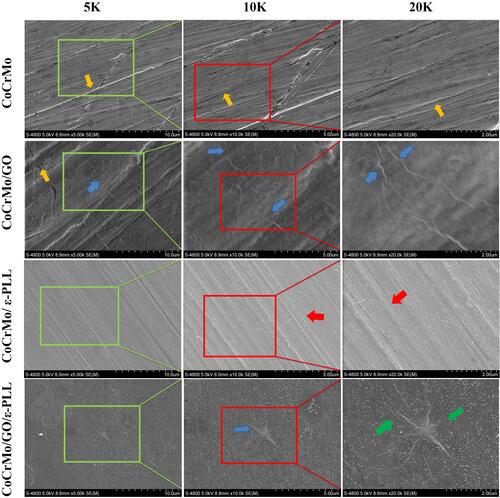
Table 1 Mean Values of Each Element in Each Group (P>0.05)
Figure 4 Energy dispersive spectra of elements in CoCrMo alloys. (A) CoCrMo; (B) CoCrMo/GO, (C) CoCrMo/ε-PLL, and (D) CoCrMo/GO/ε-PLL.
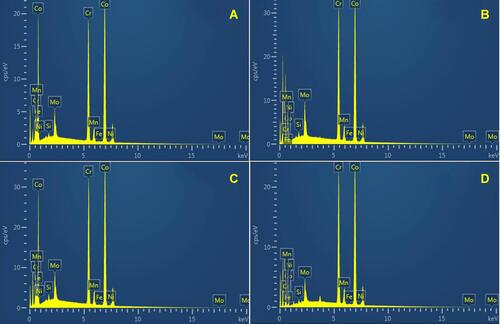
Figure 5 The surface morphology and three-dimensional structure of each group of materials.
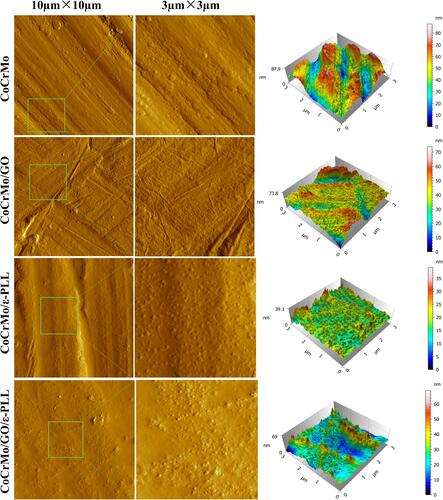
Figure 6 The comparison of four groups of roughness (*P<0.01, **P<0.001).
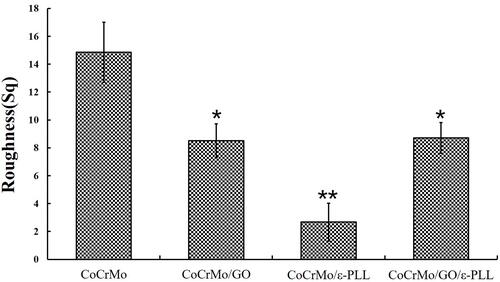
Figure 7 Comparison of the surface hydrophilicity of the four groups of materials (*P<0.05, **P<0.01).
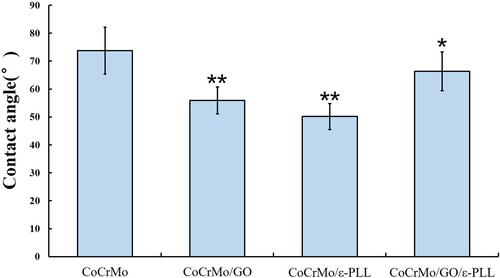
Table 2 Values of the Elastic Modulus and Vickers Hardness (*P<0.05)
Figure 8 Nanoindentation values of each group. (A) CoCrMo; (B) CoCrMo/GO, (C) CoCrMo/ε-PLL, and (D) CoCrMo/GO/ε-PLL.
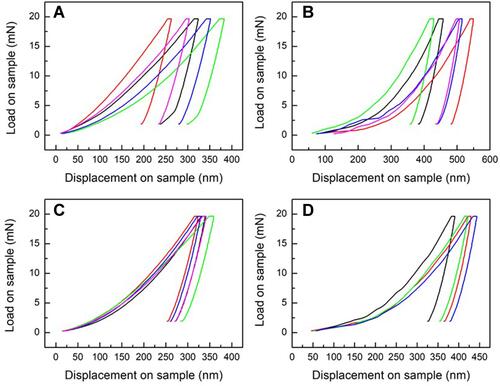
Figure 9 FTIR−ATR spectra of ε-PLL, GO, and GO/ε-PLL on CoCrMo alloy.
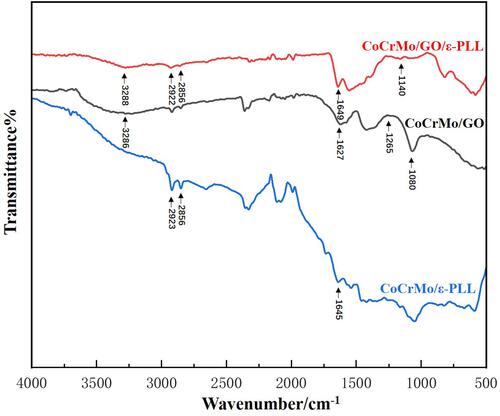
Figure 10 Morphology of S. aureus ((A) 24 h, (B) 48 h) and E. coli ((C) 24 h, (D) 48 h) on the surface of each group.
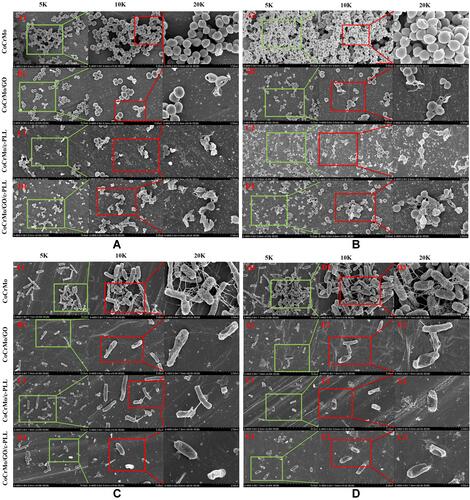
Figure 11 Fluorescence staining of living and dead bacteria from different coating surfaces. (A) S. aureus. (B) E. coli.
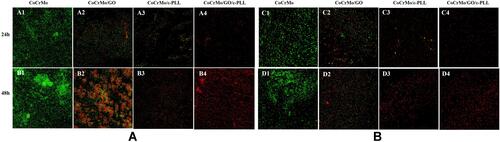
Figure 12 Bacterial colonies of S. aureus and E. coli of each group on the blood plate.
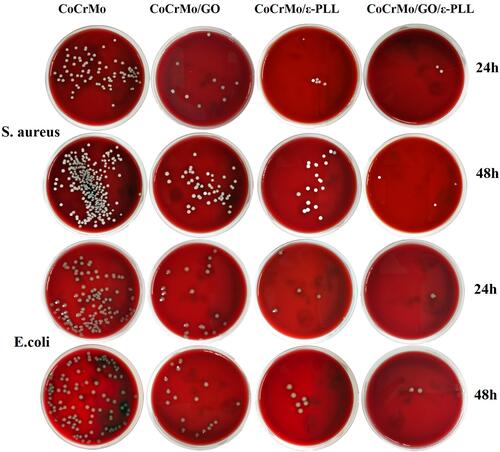
Figure 13 The relative adhesion rate and antibacterial rate of each group. The relative adhesion rate of S. aureus (A) and E. coli (B) and the antibacterial rate of S. aureus (C) and E. coli (D). *and # P<0.001.
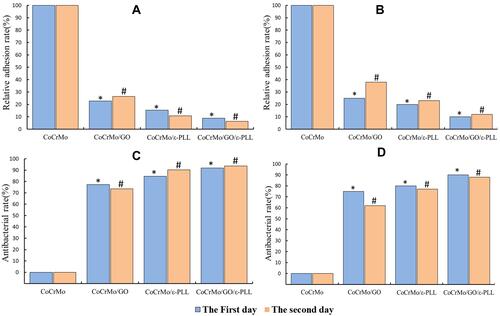
Figure 14 Fluorescence intensity of different samples (*and # P<0.01, ** and ## P<0.001). (A) S. aureus. (B) E. coli.
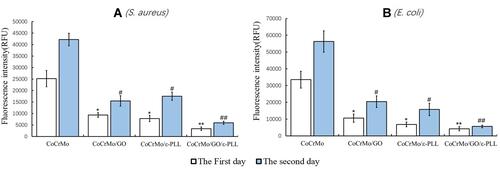
Figure 15 Biofilm structure of S. aureus (red arrow) and E. coli (green arrow).
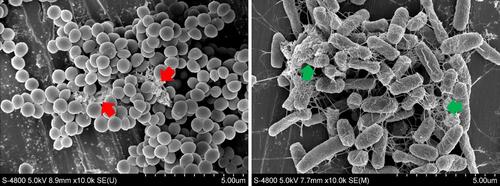
Figure 16 Results of biofilm staining. (A) S. aureus. (B) E. coli.
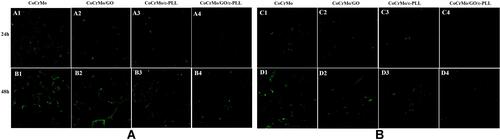
Figure 17 Results of CV assay (*and # P<0.05, ** and ## P<0.01). (A) S. aureus. (B) E. coli.
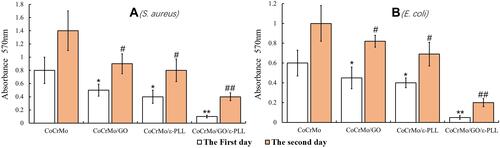
Figure 18 Inhibition zone experiment of each group. (A) CoCrMo; (B) CoCrMo/GO, (C) CoCrMo/ε-PLL, and (D) CoCrMo/GO/ε-PLL.
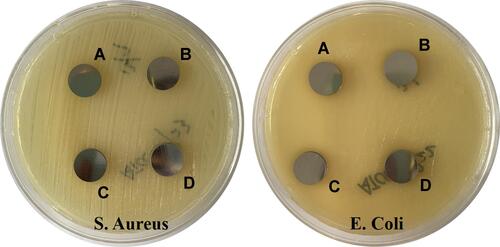
Figure 19 Fluorescence intensity of DCF on each group (*and # P<0.05, ** and ## P<0.01). (A) S. aureus. (B) E. coli.
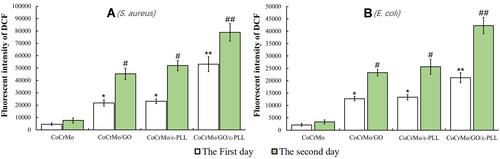
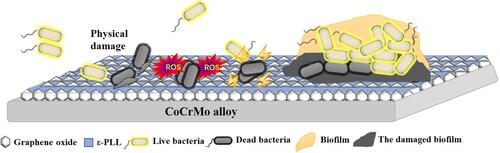
Figure 20 Antimicrobial and biofilm resistance mechanisms of GO and ε-PLL on CoCrMo alloy.