Figures & data
Table 1 Physicochemical properties of nanoparticles (n = 3)
Figure 1 TEM micrograph of DMAB-modified PLGA nanoparticles with different average sizes: (A) 50 nm; (B) 100 nm; (C) 150 nm; (D) 200 nm; and (E) 300 nm.
Abbreviations: TEM, transmission electron microscopy; DMAB, didodecyl dimethylammonium bromide; PLGA, coumarin-6 loaded poly (lactide-co-glycolide).
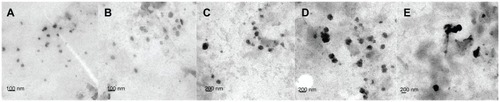
Figure 2 Cellular uptake efficiency of PVA-coated nanoparticles and DMAB-coated nanoparticles with different sizes (A). PLGA nanoparticles were incubated in Caco-2 cells (gray bars) and HT-29 cells (black bars) for 4 hours at a concentration of 500 μg/mL, at 37°C; the uptake rate is given as a function of the size of the nanoparticle (B).
Note: The calculated curve (red and blue solid lines) agreed well with the experimental data (red squares and blue circles, respectively).
Abbreviations: PVA, poly vinyl alcohol; DMAB, didodecyl dimethylammonium bromide; PLGA, coumarin-6 loaded poly (lactide-co-glycolide).
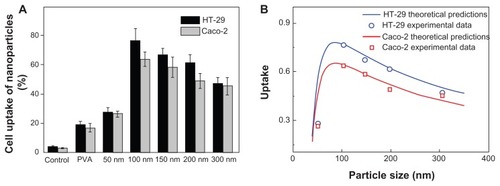
Figure 3 Schematic view of a nanoparticle adhering to a cell.
Abbreviations: R0, original radius of the cell; R, radius of the deformed cell; z, an index by which to estimate the percentage of the particles taken by the cell.
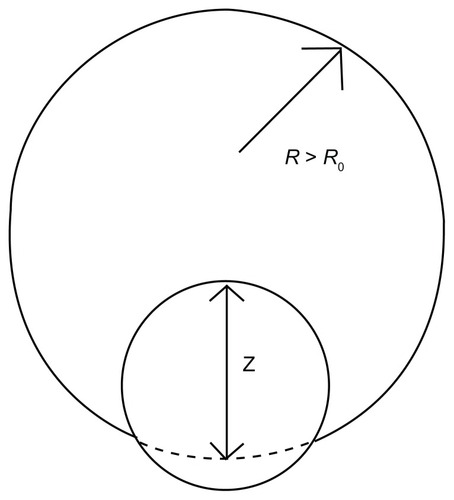
Figure 4 Schematic view of the interaction between nanoparticles and cells.
Note: The Deserno’s model showed that the uptake of the nanoparticles occurred as a result of the competition between the bending energy and the stretching energy.
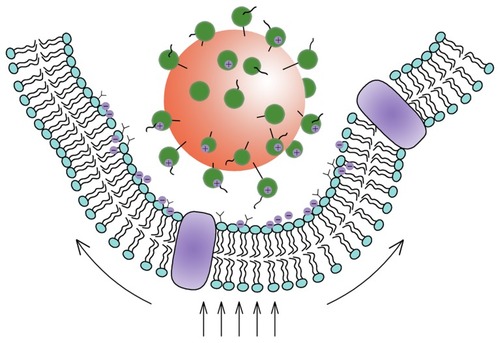
Figure 5 Confocal microscopic images of (A) Caco-2 cells and (B) HT-29 cells incubating with DMAB-modified C6-loaded nanoparticles of (a) 100 nm and (c) 50 nm for 4 hours at the concentration of 500 μg/mL, at 37°C. The close-ups of entrapped fluorescent nanoparticles (green) could be observed directly in the right panels [(b) and (d)].
Note: Scale bars = 20 μm.
Abbreviations: DMAB, didodecyl dimethylammonium bromide; C6, coumarin-6.
![Figure 5 Confocal microscopic images of (A) Caco-2 cells and (B) HT-29 cells incubating with DMAB-modified C6-loaded nanoparticles of (a) 100 nm and (c) 50 nm for 4 hours at the concentration of 500 μg/mL, at 37°C. The close-ups of entrapped fluorescent nanoparticles (green) could be observed directly in the right panels [(b) and (d)].Note: Scale bars = 20 μm.Abbreviations: DMAB, didodecyl dimethylammonium bromide; C6, coumarin-6.](/cms/asset/4edf75be-d6d2-4b7f-b1c7-a4e7f46b5150/dijn_a_32188_f0005_c.jpg)