Figures & data
Figure 1 Powder X-ray diffraction patterns for the nanocomposite, PMAE (A). Inset shows the X-ray diffraction patterns for the nanocomposites PZAE (B) and PZAC (C).Citation21
Abbreviations: PMAE, perindopril intercalated into Mg/Al by ion-exchange; PZAE, perindopril intercalated into Zn/Al by ion-exchange; PZAC, perindopril intercalated into Zn/Al by coprecipitation method.
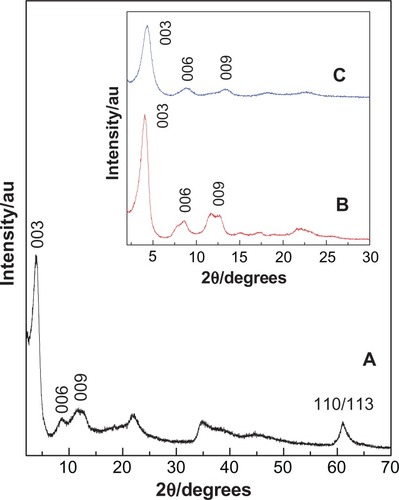
Table 1 XRD data of diffraction peaks and the lattice parameters of PMAE, PZAE and PZAC nanocomposites
Figure 2 Three-dimension structure of perindopril erbumine (A) and molecular structural models of perindopril intercalated between interlayers of Mg/Al-LDH (B).
Abbreviations: Mg, magnesium; Al, aluminum; LDH, layered double hydroxide.
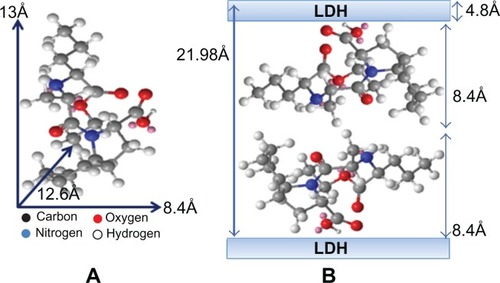
Figure 3 Fourier transform infrared spectra of perindopril erbumine (A) and PMAE nanocomposite (B). Inset shows the Fourier transform infrared spectra of the nanocomposites PZAE (C) and PZAC (D).Citation21
Abbreviations: PMAE, perindopril intercalated into Mg/Al by ion-exchange; PZAE, perindopril intercalated into Zn/Al by ion-exchange; PZAC, perindopril intercalated into Zn/Al by coprecipitation method.
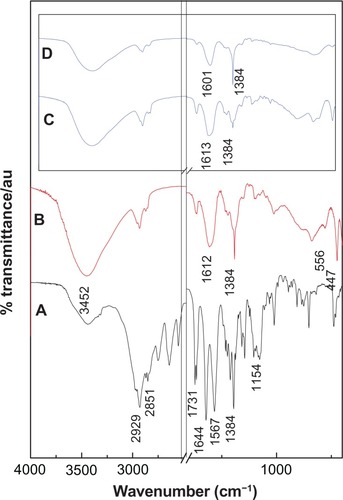
Figure 4 Thermogravimetric and differential thermogravimetric analysis of perindopril (A) and PMAE nanocomposite (B).
Abbreviation: PMAE, perindopril intercalated into Mg/Al by ion-exchange.
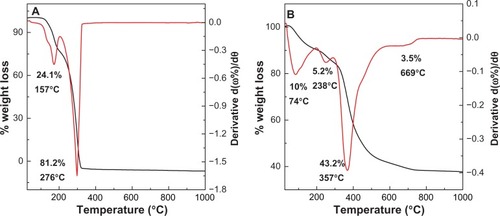
Table 2 Shows the weight loss percentages for the three types of the nanocomposites; PMAE, PZAE and PZAC
Table 3 Surface properties for the nanomaterials
Figure 5 Adsorption-desorption isotherms (A) and Barret-Joyner-Halenda pore size distributions (B) for Mg/Al-LDH and its nanocomposite with perindopril erbumine, PMAE. Inset in (A) shows the adsorption-desorption isotherms for PZAE, PZAC, and ZnAl-LDH.Citation21
Abbreviations: Mg, magnesium; Al, aluminum; LDH, layered double hydroxide; PMAE, perindopril intercalated into Mg/Al by ion-exchange; PZAE, perindopril intercalated into Zn/Al by ion-exchange; PZAC, perindopril intercalated into Zn/Al by coprecipitation method; Zn, zinc; STP, standard temperature pressure.
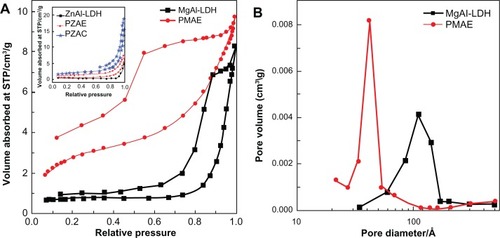
Figure 6 Field emission scanning electron microscopic images of Mg/Al-LDH (A–C) and PMAE (D–F).
Abbreviations: PMAE, perindopril intercalated into Mg/Al by ion-exchange; Mg, magnesium; Al, aluminum; LDH, layered double hydroxide.
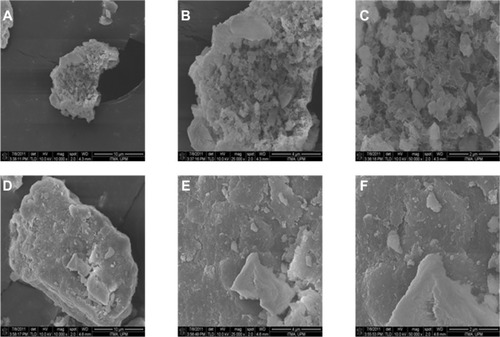
Figure 7 (I) Release profiles of perindopril from the PMAE nanocomposite at pH 4.8 (C) and pH 7.4 (D) up to 1500 minutes, (II) release profiles of perindopril up to 5000 minutes at pH 7.4. Inset shows the release profiles of perindopril from its physical mixture of perindopril with Mg/Al-LDH at pH 4.8 (A) and pH 7.4 (B).
Abbreviations: PMAE, perindopril intercalated into Mg/Al by ion-exchange; Mg, magnesium; Al, aluminum; LDH, layered double hydroxide.
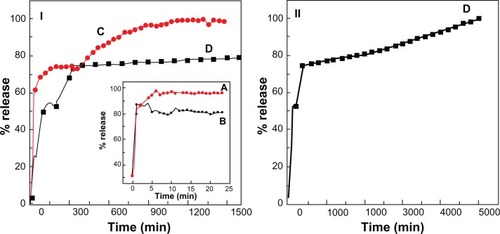
Table 4 Correlation coefficient (R2), rate constants (K) and half time (t1/2) obtained by fitting the perindopril release data from PMAE nanocomposite into solutions at pH 4.8 and 7.4
Figure 8 Fitting the data of perindopril release from PMAE at 7.4 (A–C) and at 4.8 (D–F).
Abbreviation: PMAE, perindopril intercalated into Mg/Al by ion-exchange.
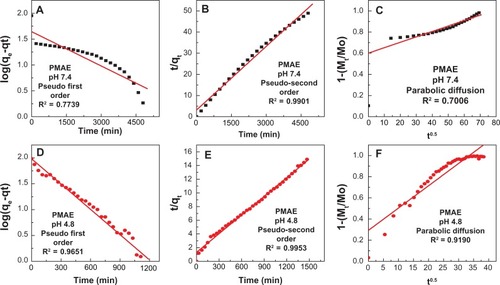
Figure 9 MTT assays of normal Chang liver cells after 24 hours of treatment with perindopril erbumine, PMAE, and Mg/Al-LDH.
Abbreviations: PMAE, perindopril intercalated into Mg/Al by ion-exchange; Mg, magnesium; Al, aluminum; LDH, layered double hydroxide.
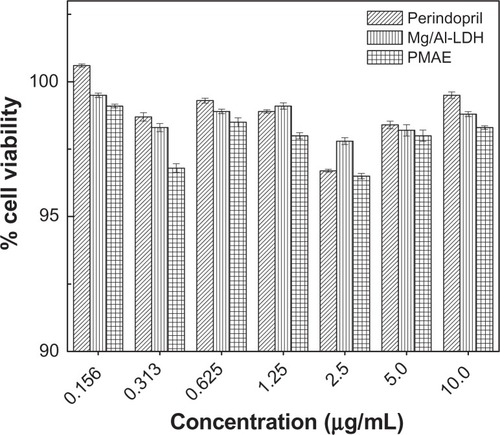
Table 5 ACE activity for perindopril erbumine, PMAE, PZAE, PZAC and Mg/Al-LDH at different exposure times
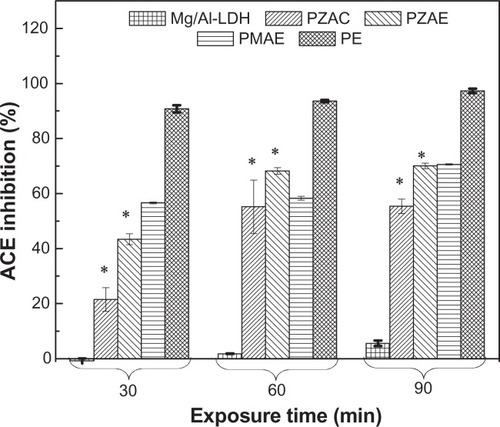
Figure 10 ACE inhibition (%) for free perindopril and intercalated perindopril, PMAE, PZAE, PZAC, and Mg/Al-LDH at exposure times of 30, 60, and 90 minutes.
Abbreviations: Mg, magnesium; Al, aluminum; LDH, layered double hydroxide; PMAE, perindopril intercalated into Mg/Al by ion-exchange; PZAE, perindopril intercalated into Zn/Al by ion-exchange; PZAC, perindopril intercalated into Zn/Al by coprecipitation method; Zn, zinc.