Figures & data
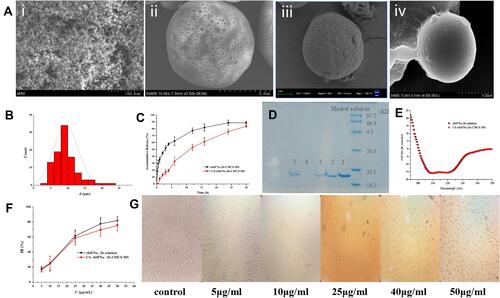
Figure 5 Characterization studies. (A) SEM images (i: CCPM; ii: surface of CCPM; iii: rhIFNα-2b-CCPM; iv: CS-rhIFNα-2b-CCPM); (B) Particle size distribution of CSrhIFNα-2b-CCPM; (C) Accumulative release from the optimal formulation; (D) Electrophoretogram of different rhIFNα-2b samples dyed by Coomassie brilliant blue (a: rhIFNα-2b solution; b: rhIFNα-2b extracted from nanoporous microspheres; c: rhIFNα-2b release solution for 12 hrs; d: rhIFNα-2b extracted from nanoporous microspheres after in vitro release for 24 hrs; e: rhIFNα-2b in effluent and washing liquid); (E) Circular dichroism spectra of rhIFNα-2b; (F) Inhibition rate of cell proliferation (n=3); and (G) Micrograph of the inhibition effect of the nanoporous microsphere releasing solution with different concentrations on A549 cells.