Figures & data
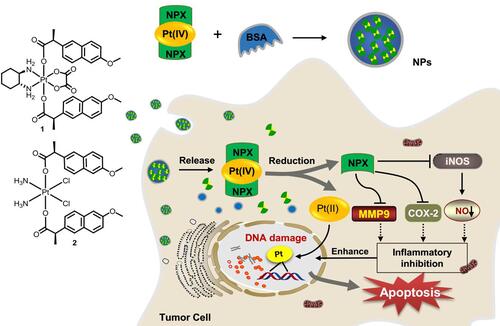
Figure 1 Structure of oxoplatins O1 and O2, dual naproxen platinum(IV) complexes 1 and 2, the preparation of nanoparticles 1-NPs and 2-NPs, and their likely antitumor mechanism.
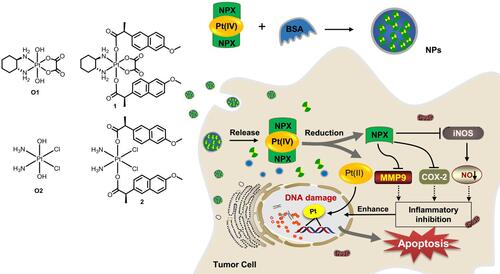
Figure 2 Mean hydrodynamic diameter determined by DLS, and TEM images of 1-NPs (A–C) and 2-NPs (D–F).
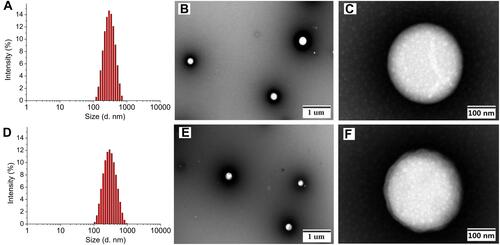
Figure 3 The particle size and PDI of (A) 1-NPs and (B) 2-NPs during storage of 30 days (pH=7.4, T=4°C).
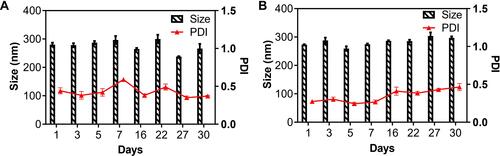
Table 1 Cytotoxicity Profiles of Naproxen Platinum(IV) Complexes Toward Four Carcinoma Cell Lines, and One Normal Human Cell Line Expressed as IC50 (μM)
Figure 4 In vivo antitumor activities of nanoparticles and free naproxen platinum(IV) compounds to CT-26 homograft tumors in BALB/c mice. Dosage: 4 μg Pt/kg for 1-NPs (i.v.), 1 (i.p.) and oxaliplatin (i.v.); 2 μg Pt/kg for 2-NPs (i.v.), 2 (i.p.) and cisplatin (i.v.). Drugs were injected on days 6, 9, 12, 14 posttumor inoculation as indicated by the arrows in . (A) Tumor growth as a function of time. (B) Tumor weight in each group at the end of the experiment. The TGI of the tested drugs are depicted above the column (TGI=tumor weight of drug treated group/tumor weight of saline group). (C) The images of the tumors at the end of the experiment. (D) The H&E staining of slices from tumor tissues.
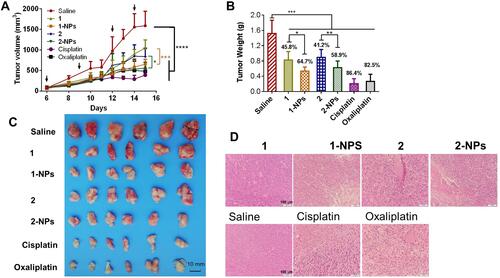
Figure 5 In vivo toxicities of tested compounds and nanoparticles to BALB/c mice. (A) The body weight of the mice during the treatment. (B) Drug accumulation in liver and kidney. (C) The H&E staining of slices from heart, liver, spleen, lung and kidney.
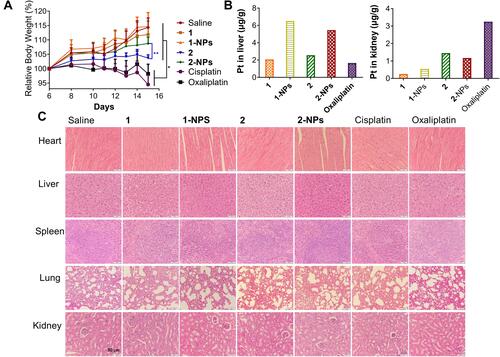
Figure 6 Accumulation of nanoparticles 1-NPs, 2-NPs and complexes 1, 2 in (A) CT-26 cells, (B) DNA after treatment of 10 h at concentration of 100 μM in vitro and in (C) tumor tissues in vivo.
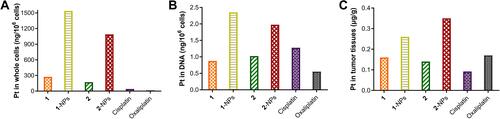
Figure 7 The inhibition of compounds 1, 2, naproxen and the reduced systems of complexes 1, 2 (Compd-AsA) at different concentrations to COX-2 with celecoxib as reference drug.
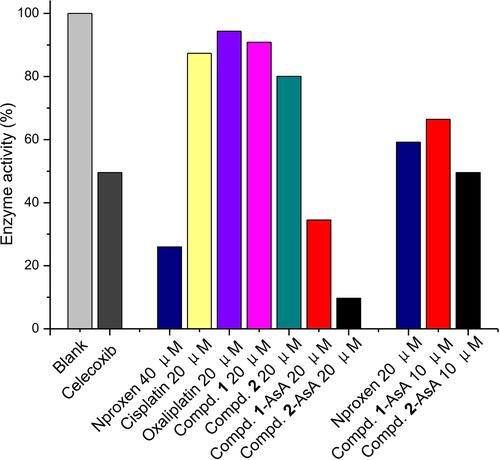
Figure 8 NO production inhibition of drugs 1, 2, 1-NPs and 2-NPs and reference drugs naproxen, cisplatin and oxaliplatin in LPS induced RAW 264.7.
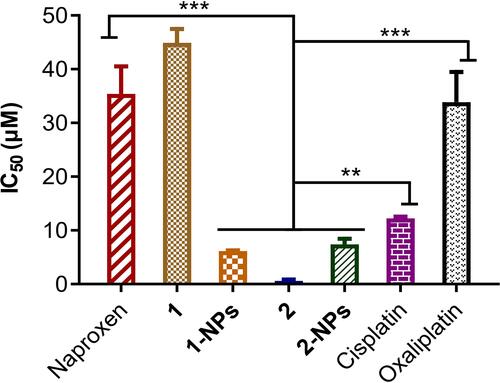
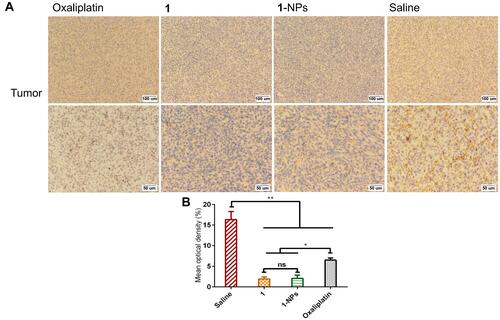
Figure 9 Photography of immunohistochemical staining of iNOS in tumor tissues from mice treated by 1, 1-NPs, oxaliplatin and saline. (A) Representative micrographs. (B) Quantified data of immunohistochemistry analysis.
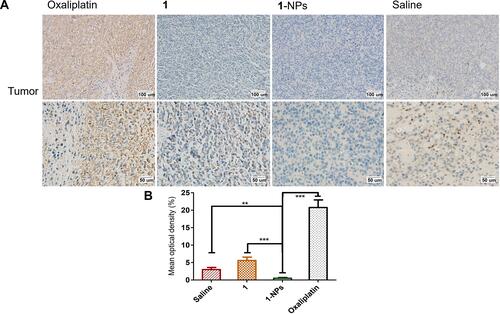
Figure 10 Photography of immunohistochemical staining of MMP-9 in tumor tissues from mice treated by 1, 1-NPs oxaliplatin and saline. (A) Representative micrographs. (B) Quantified data of immunohistochemistry analysis.