Figures & data
Scheme 1 Schematic representation of the synthesis of Au@MPA-PEG-FA-PTX.
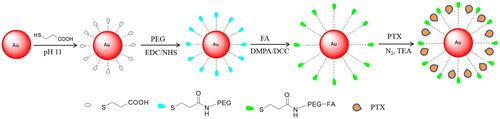
Figure 1 TEM images of AuNPs before and after modification. (A) Au@MPA; (B) Au@MPA-PEG; (C) Au@MPA-PEG-FA; (D) Au@MPA-PEG-FA-PTX.
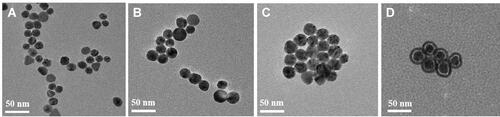
Figure 2 Change in Zeta value of AuNPs before and after modification.
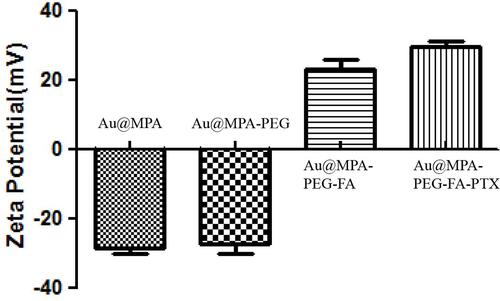
Figure 3 In vitro PTX release profiles from Au@MPA-PEG-FA-PTX with different loading contents in phosphate-buffered saline (PBS, pH 5.0, 6.5, and 7.4). The release was performed under gentle stirring and at 37 °C.
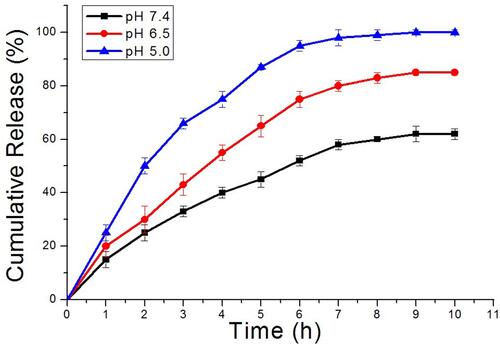
Figure 4 Apoptosis analysis in HeLa cells treated with Au@MPA-PEG-FA-PTX and PTX. (A) Control; (B–E) Au@MPA-PEG-FA-PTX (3, 5, 10, 15 μg/mL); (F) PTX: 15 μg/mL.
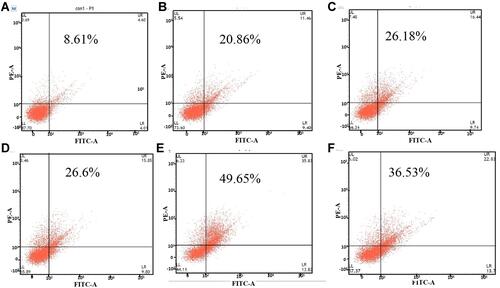
Figure 5 Apoptosis analysis in HeLa cells treated with Au@MPA-PEG-FA-PTX and PTX by AO/EB staining. (A) Control; (B–E) Au@MPA-PEG-FA-PTX (3, 5, 10, 15 μg/mL); (F) PTX: 15 μg/mL.
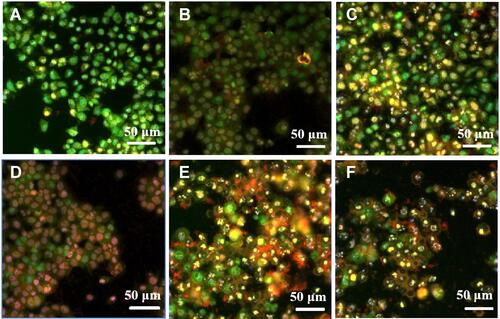
Figure 6 Flow cytometry analysis of Au@MPA-PEG-FA-PTX effect on MMP in HeLa cells. (A) Control, (B) 3 μg/mL, (C) 5 μg/mL, (D) 15 μg/mL.
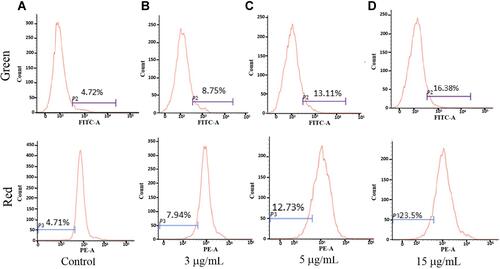
Figure 7 High content imaging of Au@MPA-PEG-FA-PTX effect on MMP in HeLa cells. (A) Control, (B–F) Au@MPA-PEG-FA-PTX (1, 3, 5, 10, 15 μg/mL).
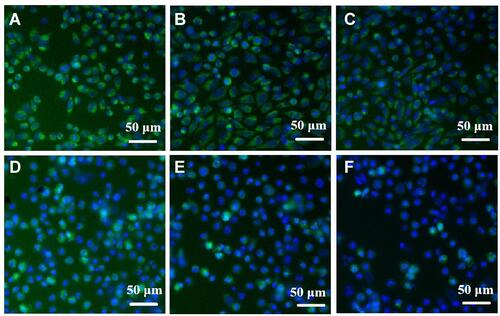
Figure 8 ROS accumulation by Au@MPA-PEG-FA-PTX. (A) Control; (B–D) Au@MPA-PEG-FA-PTX (3, 5, 15 μg/mL).
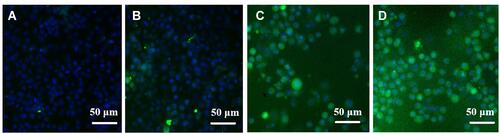
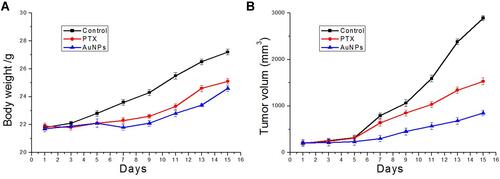
Figure 9 Anti-tumor efficacy of physiological saline, free PTX (5 mg/kg), and Au@MPA-PEG-FA-PTX (5 mg/kg) investigated following seven intravenous. (A) Body weight changes during the course of treatment; (B) changes in CT-26 tumor volumes.