Figures & data
Figure 1 Auscultation area: listening positions for S1, S2, S3, and S4 heart sounds. (A) QRS complex corresponds to S1, and T-wave corresponds to S2. (B) Position of S3 and S4.
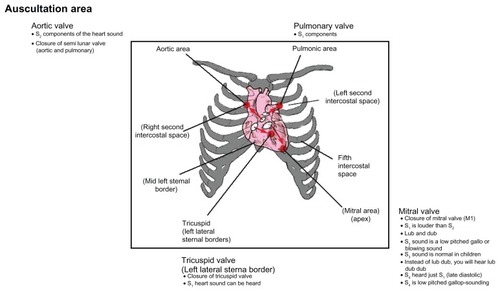
Figure 2 (A and B) Relationship of ECG and the four heart sounds.
Abbreviation: ECG, electrocardiogram.
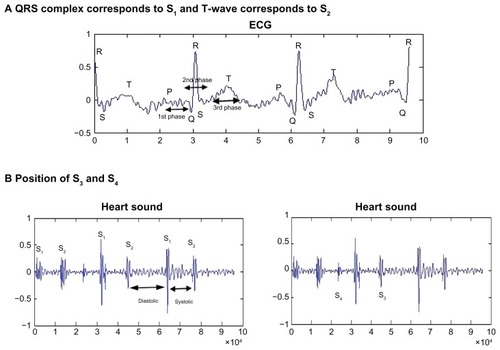
Figure 3 (A and B) Average signal of normal patient. (A) Noisy heart signal; (B) clean heart signal.
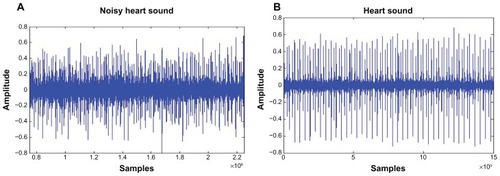
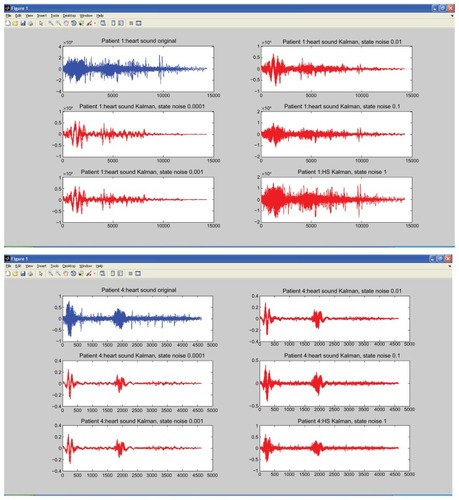
Figure 4 Processing of the HSS and ECG signals.
Abbreviations: HSS, hybrid spatial spectra; ECG, electrocardiogram.
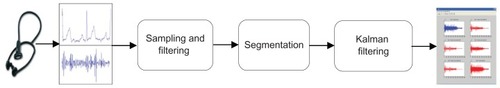
Table 1 Types of murmurs and number of cycles of heart sound per patient
Table 2 Normal and abnormal patients’ signal-to-noise ratio (SNR)
Figure 5 Overall average signal-to-noise ratio (SNR) of the ten patients.
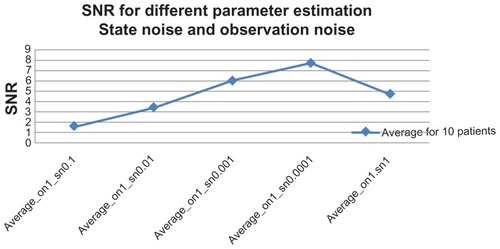
Figure 6 (A) Abnormal heart sound from a patient after the filtering process; (B) normal heart sound from a patient after the filtering process.