Figures & data
Table 1 Primer Sequences of Human Genes Examined by Quantitative Real-Time PCR
Figure 1 Characterization of Cel Nio. (A) Particles distribution of Cel Nio; (B) TEM of Cel Nio (The bar is 200 nm); (C) The stability of Cel Nio of 6 months; (D) The photograph of Cel Nio gel.
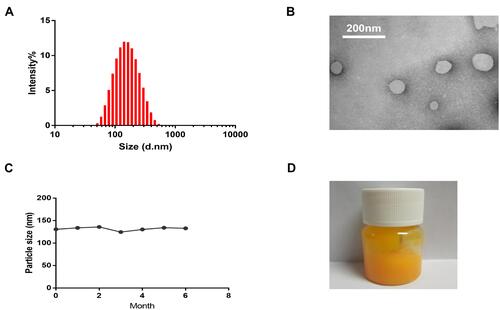
Table 2 Cel Content in the Skin, Plasma, Draining Lymph Nodes (DLN) and Mesenteric Lymph Nodes (MLN) of Mice After Administration of Cel Nio Gel (0.4 g)
Figure 2 Psoriatic symptoms on the dorsal skin of mice after IMQ and different formulations (n=6).
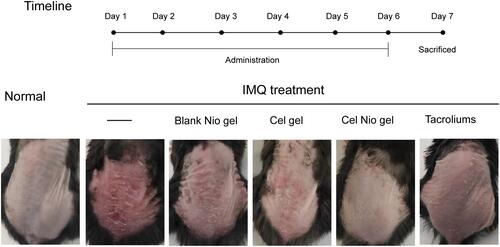
Figure 3 Inflammatory cytokine levels in the serum of mice after treatment of IMQ and different formulations. (A) IL-6; (B) IL-17A; (C) TNF-α; (D) IL-2; (E) IFN-γ. *p <0.05 **p<0.01, compared with IMQ only group; #p<0.05, compared with Cel Nio group. Values are shown as mean and SE (n=6).
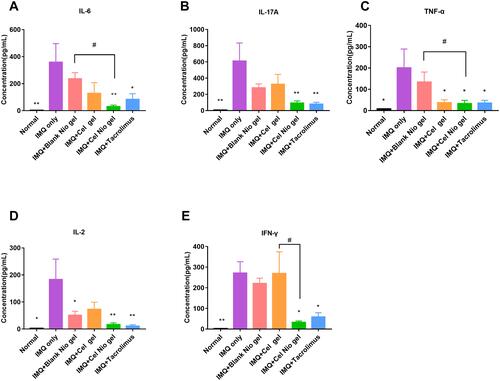
Figure 4 The uptake of free DiI and DiI-Nio by the HaCaT cells. (A) The histogram profiles. (B) Mean fluorescence intensity of the HaCaT cells treated with free DiI and DiI-Nio. ***p < 0.001, compared with Free DiI group. Values are shown as mean and SD (n=3).
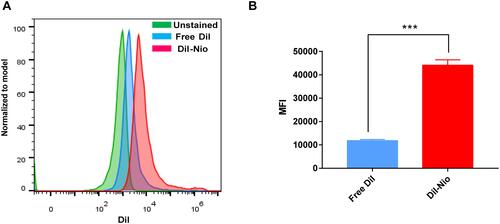
Figure 5 The mRNA levels of cytokines in the HaCaT cell after stimulation of IMQ and treatment with or without Cel. (A) IL-6; (B) TNF-α; (C) IFN-β. ***p < 0.001, compared with IMQ group. Values are shown as mean and SE (n=6).
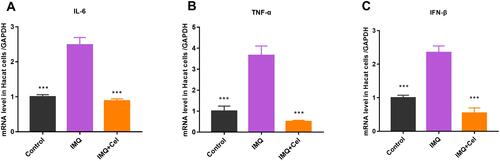
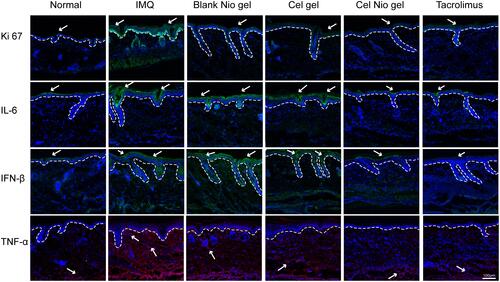
Figure 6 Expression of Ki-67, IL-6, IFN-β, and TNF-α of skin lesions after the treatment of IMQ and other formulations (n=6). Blue, DAPI; Green, Alexa Fluor 488; Red, Alexa Fluor 647. The dotted line demonstrates the border between the epidermis and dermis. Arrows label the representative positive location. Scale bar: 100 μm.