Figures & data
Table 1 The Primer Sequences Used for qRT-PCR
Figure 1 Identification of eESCs, pMφ, and pMφ-exo. (A) Detection of the biomarkers of eESCs by FCM. (B) The expression of CD11b and CD68 on pMφ detected by FCM. (C) The morphology of pMφ-exo under TEM. Scale bar = 100 nm. (D) Size and concentration of pMφ-exo analyzed by NTA. (E) The protein expression of CD9, CD63, and β-actin measured by Western blot. (F) Uptake of DiI-labeled pMφ-exo (red) in DAPI-labeled eESCs (blue). Scale bar = 20 μm. EMs-pMφ-exo and Con-pMφ-exo were extracted from EMs-pMφ and Con-pMφ.
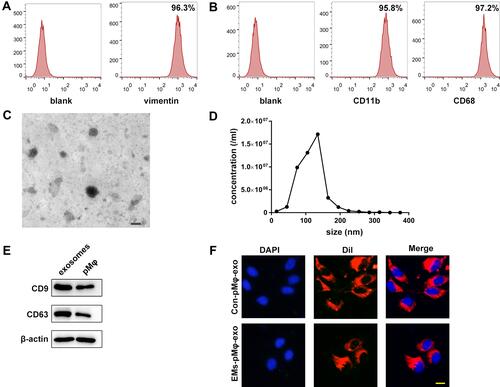
Figure 2 EMs-pMφ-exo promote eESC proliferation, migration, and invasion and inhibit their apoptosis. (A) eESC proliferation was determined through CCK-8. (B) Cell proliferation was detected by EdU assay. (C) eESC migration was measured by wound healing. (D) eESC migration and invasion was detected by Transwell assays. (E) FCM was performed to detect eESC apoptosis. *P < 0.05, **P < 0.01 versus PBS and Con-pMφ-exo groups.
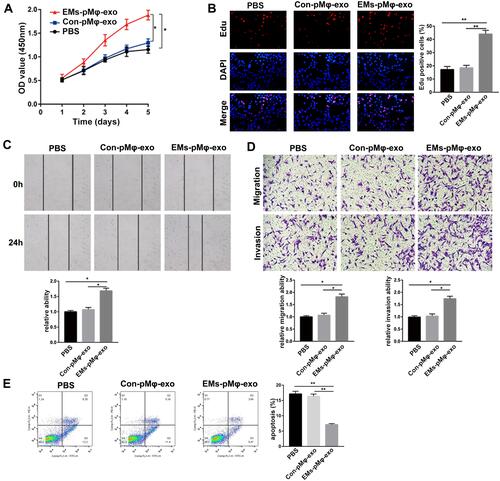
Figure 3 EMs-pMφ-exo transports lncRNA CHL1-AS1 into eESCs. (A) The expression of lncRNA CHL1-AS1 in EMs-pMφ-exo and Con-pMφ-exo by qRT-PCR. (B) The expression of lncRNA CHL1-AS1 in eESCs after co-cultured with EMs-pMφ-exo and Con-pMφ-exo. (C)The expression of lncRNA CHL1-AS1 in exosomes isolated from CHL1-AS1-interfering EMs-pMφ. (D) The expression of lncRNA CHL1-AS1 in eESCs co-cultured with EMs-pMφ-exosi-CHL1-AS1 or EMs-pMφ-exosi-control for 48 h. **P < 0.01 versus Con-pMφ-exo or EMs-pMφ-exosi-control. si-CHL1-AS1, small interfering RNA of CHL1-AS1.
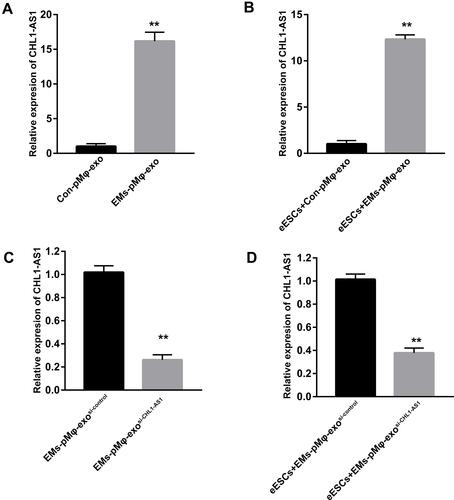
Figure 4 LncRNA CHL1-AS1 in EMs-pMφ-exo promotes eESCs cell proliferation, migration and invasion and represses eESCs apoptosis. eESCs were incubated with Con-pMφ-exo, EMs-pMφ-exo, EMs-pMφ-exosi-control, or EMs-pMφ-exosi-CHL1-AS1 for 24 h. (A) eESC viability was measured by CCK-8 assay. (B) EdU assay were performed to detect eESCs proliferation. (C) eESCs migration measured by wound healing. (D) eESCs migration and invasion detected by Transwell assays. (E) FCM was used to detect eESCs apoptosis. *P < 0.05, **P < 0.01 versus the EMs-pMφ-exo and EMs-pMφ-exosi-control groups.
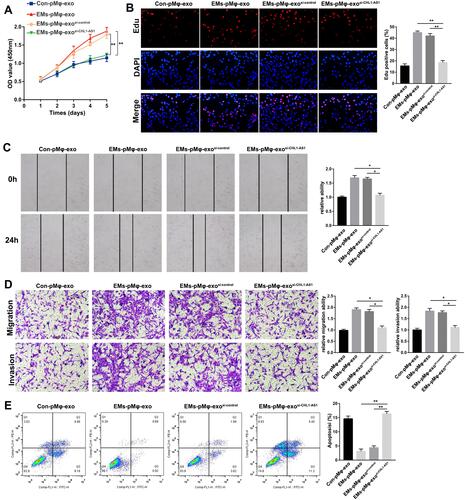
Figure 5 LncRNA CHL1-AS1 acts as a ceRNA by sponging miR-610 to regulate MDM2. (A) Prediction of binding sites between lncRNA CHL1-AS1 and miR-610. (B) The binding between lncRNA CHL1-AS1 and miR-610 as assessed by luciferase activity assay, **P < 0.01 versus the CHL1-AS1-wt + mimics NC group. (C) The binding of lncRNA CHL1-AS1 and miR-610 as assessed by RIP assay, **P < 0.01 versus IgG. (D) Enrichment of lncRNA CHL1-AS1 by miR-610 detected by RNA pull-down assay, **P < 0.01 versus Bio-NC and Bio-miR-610-mut. (E) Prediction of binding sites between miR-610 and MDM2. (F) The binding between miR-610 and MDM2 as assessed by luciferase activity assay, **P < 0.01 versus MDM2-wt + mimics NC group. (G) MDM2 protein expression of MDM2 in si-CHL1-AS1-treated eESCs measured by Western blot. (H) MDM2 protein expression in miR-610 mimics-treated eESCs measured by Western blot.
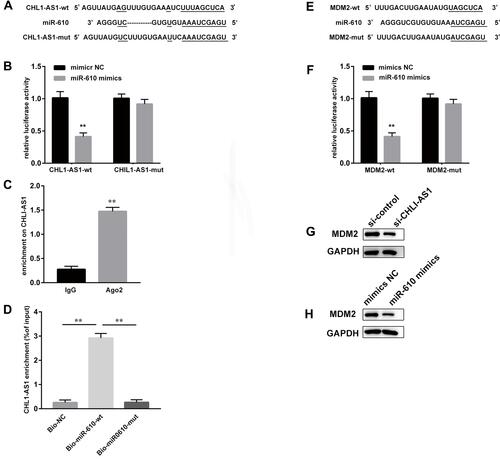
Figure 6 EMs-pMφ-exo shuttled lncRNA CHL1-AS1 downregulates miR-610 and upregulates MDM2 to promote eESCs proliferation, migration, and invasion and inhibit apoptosis. eESCs were treated with EMs-pMφ-exosi-control, EMs-pMφ-exo,si-CHL1-AS1 miR-610 inhibitors, or inhibitors NC. The proliferation, migration, invasion, and apoptosis of treated eESCs were detected by CCK-8 (A), EdU assay (B), Transwell assay (C), and FCM (D) respectively, **P < 0.01 versus the EMs-pMφ-exosi-CHL1-AS1 and EMs-pMφ-exosi-CHL1-AS1 + inhibitors NC groups. Then, eESCs were treated with EMs-pMφ-exosi-control, EMs-pMφ-exo,si-CHL1-AS1 MDM2 overexpression vector, or empty vector. The proliferation, migration, invasion, and apoptosis of treated eESCs were detected by CCK-8 (E), EdU assay (F), Transwell assay (G), and FCM (H) respectively. **P < 0.01 versus the EMs-pMφ-exosi-CHL1-AS1 and EMs-pMφ-exosi-CHL1-AS1 + empty vector groups.
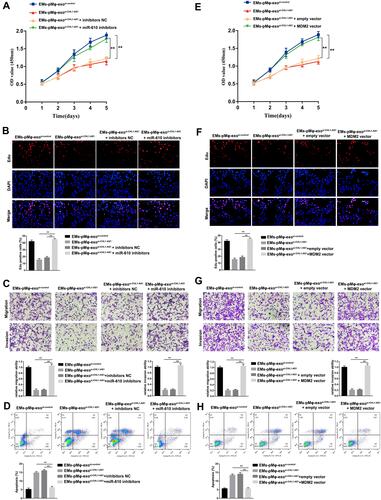
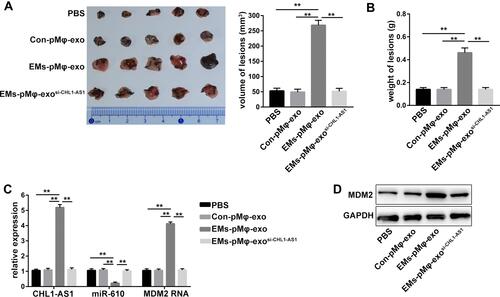
Figure 7 LncRNA CHL1-AS1 in EMs-pMφ-exo promotes EMs lesions growth by increasing MDM2 in vivo. (A) Total volume of EMs lesions. (B) Total weight of EMs lesions. (C) qRT-PCR was carried out to measure the RNA expression of CHL1-AS1, miR-610, and MDM2 in EMs lesions. (D) MDM2 protein level in EMs lesions was detected by Western blot. **P < 0.01 versus the PBS, Con-pMφ-exo, and EMs-pMφ-exosi-CHL1-AS1 groups.