Figures & data
Table 1 Sequences of peptides used in the present study
Figure 1 (A) Amino acid sequences of peptides used and conjugated with FITC. (B) FITC is conjugated at the C-termini of the peptides via a hydrazine bridge.
Abbreviation: FITC, fluorescein isothiocyanate.
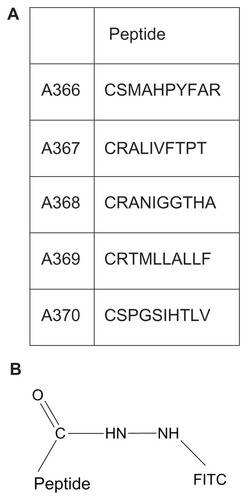
Figure 2 Induction of TrkB expression in SH-SY5Y cells by ATRA-treatment. (A) In SH-SY5Y cells, TrkB was induced by 5 days ATRA-treatment at mRNA level shown by real-time PCR. (B) Its induction and presence on the cell surface was detected at protein level by flow cytometry. Xmean (y-axis) refers to the average detected FITC-fluorescence intensity, based on immunocytochemical reaction and done by using anti-TrKB polyclonal antibody and anti-rabbit Alexa 488-labeled secondary antibody.
Abbreviations: ATRA, all-trans-retiuoic acid; mRNA, messenger RNA; TrKB, tyrosine kinase B; PCR, polymerase chain reaction.
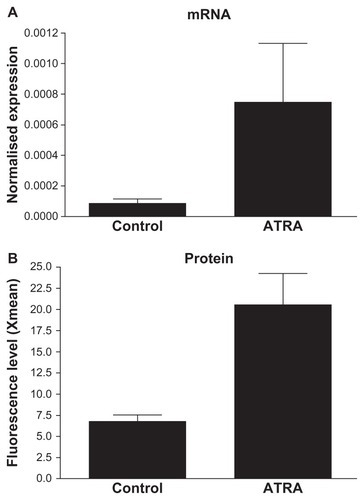
Table 2 Z-average diameters and polydispersity of control liposomes and peptide-conjugated liposomes
Table 3 Binding of designed peptides to TrkB+ and TrkA+ cells, with relative specificities given as the TrkB+/TrkA+ ratio
Figure 3 (A–F) Colocalization of fluorescein-labeled TrkB binding peptides (A366 and A371, green) and Alexa 633-labeled monoclonal anti-TrkB antibodies (red) to RAW264 cells. (G) Two-dimensional FACS plot made with similarly stained RAW264 cells.
Abbreviations: FITC-A, fluorescein isothiocyanate-labeled A366 peptide; PE-A, phycoerythrin-conjugated AD3F10 antibody; TrkB, tyrosine kinase B.
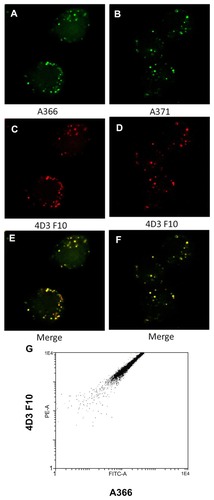
Figure 4 (A) Binding of A415-PCL to TrkB positive cells (6 or 20 hours). Binding of A415-PCL to TrkB-positive cells in the presence (1 mM) or absence of competing free peptides (48 hours). (B) Binding of Scr-A415-PCL to TrkB-positive cells (6 or 20 hours). Binding of Scr-A415 PCL to TrkB-positive cells in the presence (1 mM) or absence of competing free peptides (48 hours). (C) Binding of A417-PCL to TrkB-positive cells (6 or 20 hours). Binding of A417-PCL to TrkB-positive cells in the presence (1 mM) or absence of competing free peptides (48 hours).
Notes: Control depicts the level of background fluorescence of the cells.
Abbreviations: PCL, peptide-conjugated liposomes; TrkB, tyrosine kinase B.
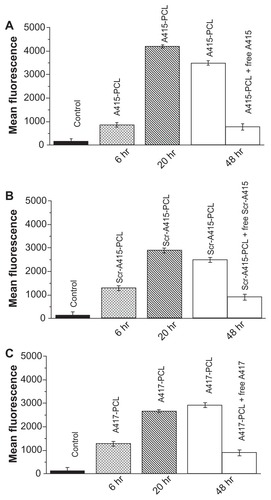
Figure 5 Early cleavage of the targeting peptide reduces internalization of PCL.
Notes: Fluorescent A415 PCL were treated with TeV protease at 0, 20 minutes, and one and 6 hours after their addition to the cell cultures and fluorescence intensities were measured at 6, 22, and 48 hours after the addition of PCL. Control liposomes without peptide (□), A415-PCL (●), A415-PCL+TeV (0 minutes, ▲), A415-PCL+TeV (20 minutes, ▼), A415-PCL+TeV (one hour, ◆), and A415-PCL+TeV (6 hours ◀).
Abbreviation: PCL, peptide-conjugated liposomes.
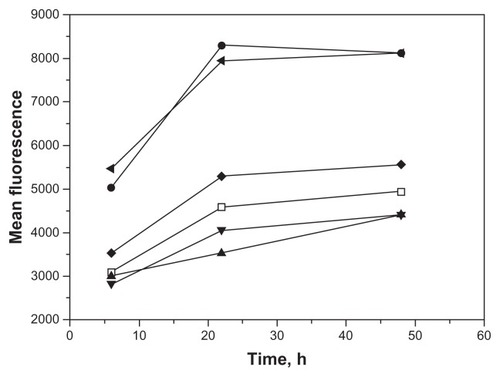
Figure 6 Kinetics of binding of PCL with fluorescein-labeled A415 (A) or the scrambled peptide Scr-A415 (B) added into a suspension of RAW264 cells with constant rotation.
Notes: Fluorescence of individual cells was monitored for 20 minutes by FACS and is illustrated as a contour plot, with time in seconds (×100) on horizontal axis and number of binding events on the vertical axis, with colors representing relative density of cells in each location within the plot showing increasing frequency from red to green. The data show significantly faster binding kinetics for the liposomes with the covalently coupled targeting peptide A415 compared with the scrambled peptide.
Abbreviation: PCL, peptide-conjugated liposomes.
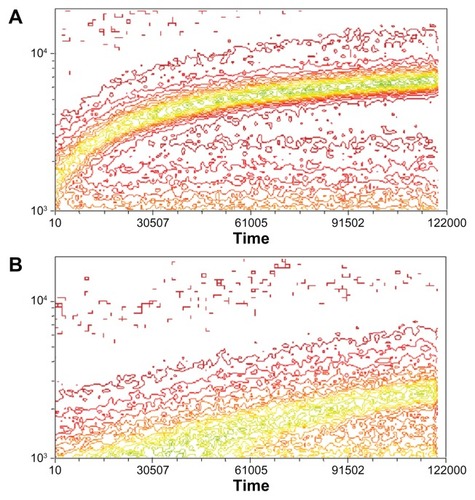
Figure 7 Selective uptake of A415-PCL by ATRA-treated SH-SY5Y cells, the selectivity being dependent on incubation time. (A) ATRA-treated SH-SY5Y cells incubated with A415-PCL for 20 minutes. (B) ATRA-treated SH-SY5Y cells incubated with Scr-A415-PCL for 20 minutes. (C) ATRA-treated SH-SY5Y cells incubated with A415-PCL for 4 hours. (D) ATRA-treated SH-SY5Y cells incubated with Scr-A415-PCL for 4 hours.
Note: Bar corresponds to100 μm.
Abbreviations: ATRA, all-trans-retinoic acid; PCL, peptide-conjugated liposomes.
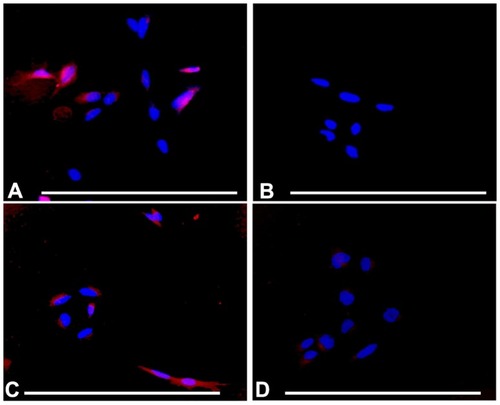
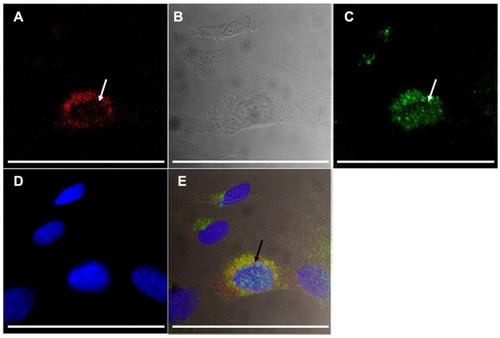
Figure 8 Uptake of A415-PCL by ATRA-treated SH-SY5Y TrkB+ cells after 8 hours of incubation, showing partial colocalization with the anti-early endosomal 1 antibody (arrows). Fluorescence of A415-PCL-labeled with TRITC (A), differential contrast image (B), immunocytochemistry of early endosomal autoantigene-1 (fluorescein isothiocyanate-labeled, (C), nuclear counterstaining (D), and merge of panels A–D (E).
Note: Bar illustrates 100 μm.
Abbreviations: ATRA, all-trans-retinoic acid; PCL, peptide-conjugated liposomes.