Figures & data
Figure 1 Chemical structure of sorafenib.
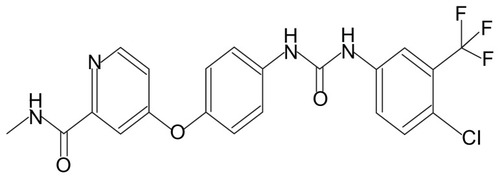
Figure 2 Schematic representation of technological process of preparation of S-SLN.
Abbreviation: S-SLN, sorafenib solid lipid nanoparticle singular.
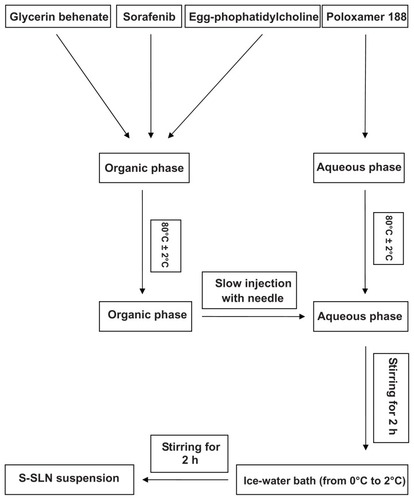
Table 1 Factors and levels of the orthogonal test
Table 2 The scheme and results of L9 (3Citation4) orthogonal test
Table 3 The results of variance analysis
Figure 3 TEM photograph of S-SLN.
Abbreviation: S-SLN, sorefenib solid lipid nanopraticles.
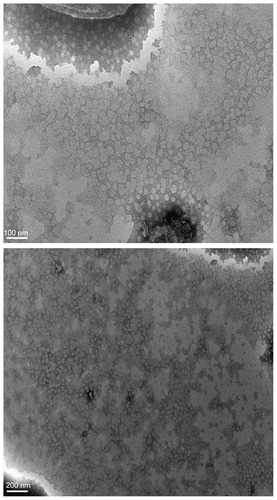
Figure 4 Size distribution of S-SLN.
Abbreviation: S-SLN, sorefenib solid lipid nanopraticles.
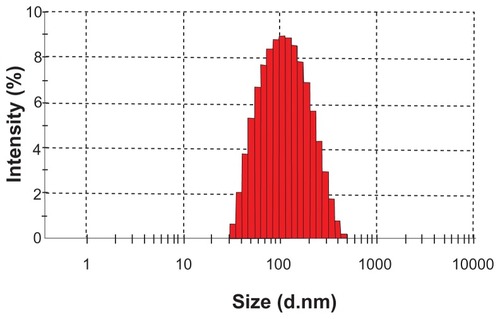
Figure 5 Zeta potential distribution of S-SLN.
Abbreviation: S-SLN, sorefenib solid lipid nanopraticles.
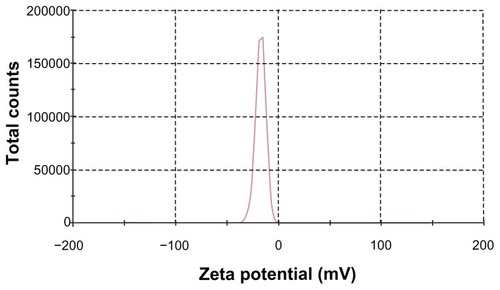
Table 4 Fitting equation of the accumulative release percentage of sorafenib SLN in vitro
Figure 6 In vitro release of sorafenib from SLN in pH 7.4 phosphate-buffer solution at 37°C ± 1°C.
Note: Data represent mean ± SD (n = 3).
Abbreviation: SLN, solid lipid nanopraticles.
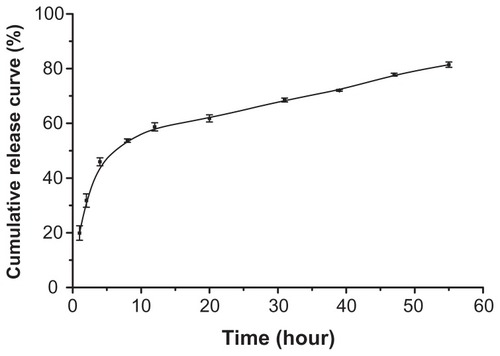
Table 5 The appearance, dissolution time, solution color and mean particle size of the lyophilization powder of S-SLN
Figure 7 DSC thermograms of (A) egg-phophatidylcholine, (B) S-SLN, (C) glycerin behenate, (D) physical mixture of poloxamer188, sorafenib, glycerin behenate, EPC, (E) sorafenib and (F) poloxamer 188.
Abbreviations: DSC, differential scanning calorimetry; EPC, egg-phosphatidylcholine; S-SLN, sorafenib solid lipid nanoparticle.
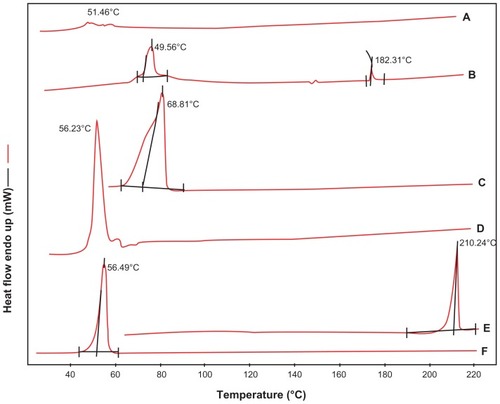
Table 6 The results of accuracies
Table 7 The results of method recovery in plasma (n = 3)
Figure 8 HPLC chromatogram of (A) sorafenib control in blank plasma, (B) plasma sample after S-SLN administration and (C) blank plasma.
Abbreviations: HPLC, high-performance liquid chrematography; S-SLN, sorafenib solid lipid nanopraticle.
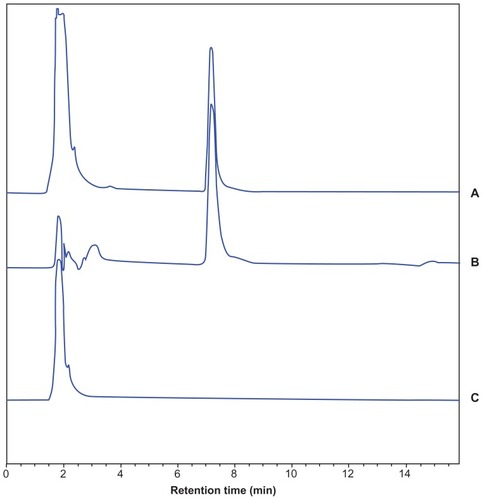
Table 8 Plasma pharmacokinetic parameters after intravenous administration of sorafenib solution in rabbits (n = 4)
Table 9 The plasma pharmacokinetic parameters after intravenous administration of S-SLN in rabbits (n = 4)
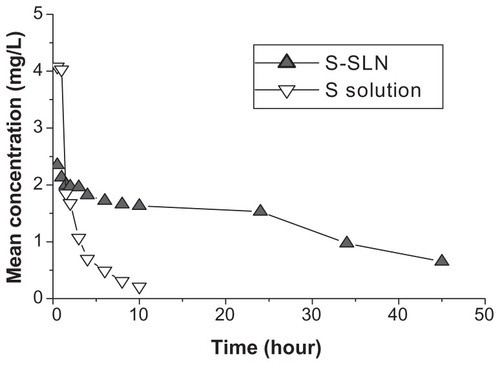
Figure 9 The mean concentration-time curve of sorafenib in plasma after iv administration sorafenib and S-SLN in rabbits (n = 4).
Abbreviation: S-SLN, sorafenib solid lipid nanoparticle.