Figures & data
Table 1 DLS, PdI and Zeta Potential Values of TiO2 Nanoparticle in Different Medium
Figure 1 TEM and HR-TEM images. (A) TiO2-10 µg/mL, (B) TiO2-100 µg/mL, (C) TiO2-1000 µg/mL, (D) TiO2-2000 µg/mL.
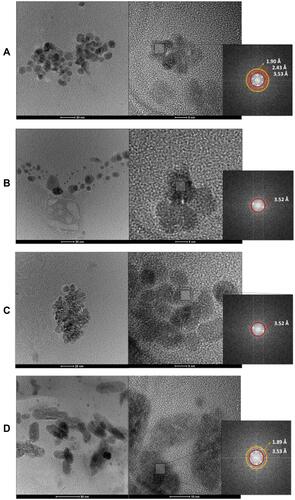
Figure 2 Absorption and fluorescence emission spectra of mixtures of TiO2NP. (A) Absorption spectra of 2000, 1000 and 100 µg/mL TiO2NP in water. (B) Fluorescence emission spectra of TiO2NP at concentrations of 100, 1000 and 2000 µg/mL.
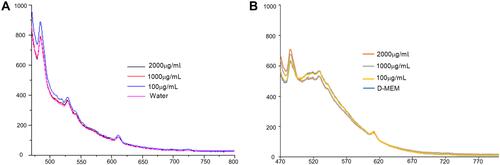
Figure 3 Cytotoxicity through mitochondrial activity and lactate dehydrogenase assay. (A) The cell viability of HaCaT cells after TiO2 NP exposure for 24, 48, and 72 h; (B) release of LDH for HaCaT cells; (C) the cell viability of HDFn cells after TiO2 NP exposure for 24, 48, and 72 h; (D) release of LDH for HDFn cells. Cell morphology of HaCaT and HDFn cells of exposure to different concentrations of TiO2 NP for 72h. (E) Control HaCaT; (F) 10 µg/mL, (G) 100 µg/mL, (H) 1000 µg/mL and (I) 2000 µg/mL; (J) control HDFn; (K) 10 µg/mL, (L) 100 µg/mL, (M) 1000 µg/mL and (N) 2000 µg/mL. The statistical analysis was performed comparing the control group cell viability with TiO2 NP treatments by two-way ANOVA (Dunnett’s post-hoc); *p < 0.05.
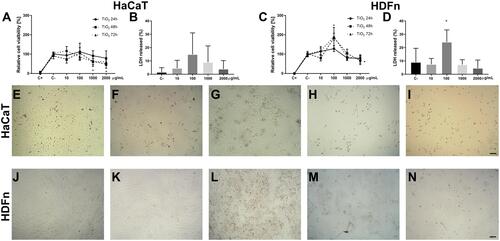
Figure 4 TiO2 NP-induced cytokine production after the 72-exposure period. (A) Interferon-gamma (INT- γ), (B) interleukin-8 (IL-8), (C) I interleukin-10 (IL-10) when HaCaT were exposed to TiO2 NP. (D) Interferon-gamma (INT- γ), (E) interleukin-6 (IL-6) when HDFn were exposed to TiO2 NP. The statistical analysis was performed comparing the cytokine content among control group and TiO2 NP treatments by one-way ANOVA (Tukey post-hoc); p *< 0.05, p **< 0.01, p ***< 0.001.
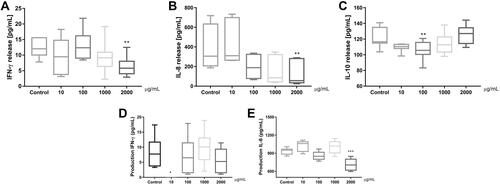
Figure 5 ROS production. Graphs and representative figures of fluorescence emitted after 72 hours of exposure in HaCat cells and HDFn cells respectively. (A) Representative graph of ROS production for HaCaT cells and (B) representative graph of ROS production for HDFn cells. Fluorescence microscopy images of HaCaT and HDFn cells of exposure to different concentrations of TiO2 NP for 72h. (C) Control HaCaT, (D) 10 µg/mL, (E) 100 µg/mL, (F) 1000 µg/mL and (G) 2000 µg/mL for the HaCaT cells. (H) Control HDFn, (I) 10 µg/mL, (J) 100 µg/mL, (K) 1000 µg/mL and (L) 2000 µg/mL for the HDFn cells. The statistical analysis was performed comparing the control group cell viability with TiO2 NP treatments by one-way ANOVA (Tuckey post-hoc); * p < 0.05.
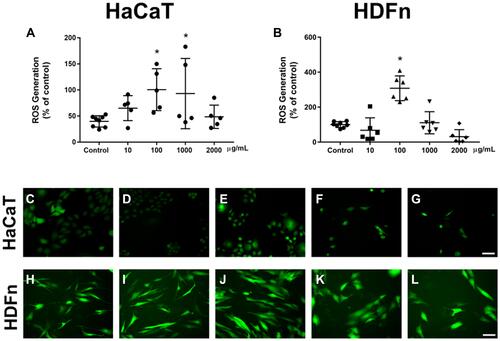
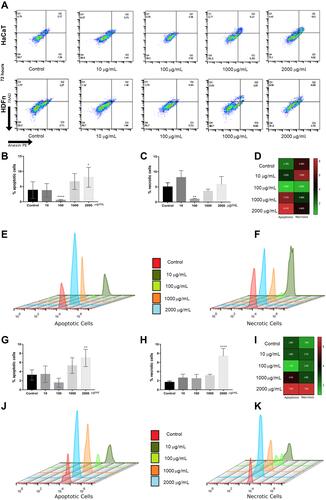
Figure 6 Apoptosis and necrosis by flow cytometry with PE markers annexin V and 7AAD. (A) DotPlot results referring to HaCat and HDFn cells respectively. (B) and (C) Representative graphs of apoptosis and necrosis respectively for HaCat cells. (D) Demonstration of apoptosis/necrosis by heatMap for HaCat cells. (E) Represent the peaks of apoptosis when HaCaT cells were exposed to TiO2 NP. (F) Represent the peaks of necrosis when HaCaT cells were exposed to TiO2 NP. (G and H) Representative graphs of apoptosis and necrosis respectively for HDFn cells. (I) Demonstration of apoptosis/necrosis by heatMap for HDFn cells. (J and K) represent the peaks of apoptosis and necrosis respectively when HDFn cells were exposed to TiO2 NP. vs control; *p<0,05, **p<0.01, ****p<0.0001.