Figures & data
Table 1 The Oligonucleotide Sequences of Each ssDNA Used in the Study
Scheme 1 Schematic display of the assembly and radiolabeling process of 99mTc-DCN.
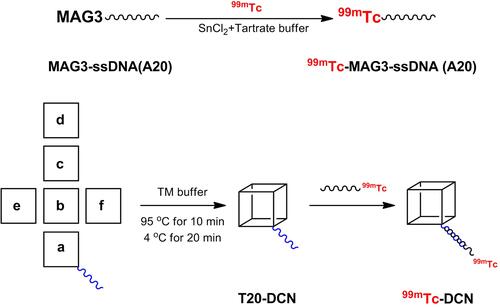
Figure 1 Preparation and Characterization of DCN. (A) Characterization of the DCN self-assembly process by PAGE. M1, 50 bp marker. M2, 20 bp marker; (B) AFM image of DCN. Scale bar: 50 nm; (C) FRET analysis of DCN. A FRET pair (Cy3 and Cy5) was designed on the same vertex of DCN, and FRET effect could be observed during the assembly of DCN; (D) HPLC analysis of DCN, and the retention time was about 14 min.
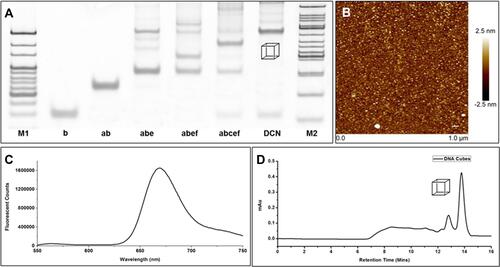
Figure 2 Radio-TLC image of 99mTc-MAG3-ssDNA (A20) under 2 developing system. Black line: 100% Acetone; Red line: 0.9% saline.
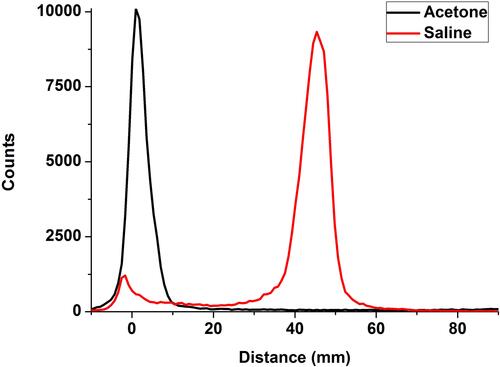
Figure 3 Radio-HPLC analysis of DNA samples. The RT of 99mTc-DCN was at ~12 min, and 99mTc-MAG3-ssDNA (A20) was at ~22 min.
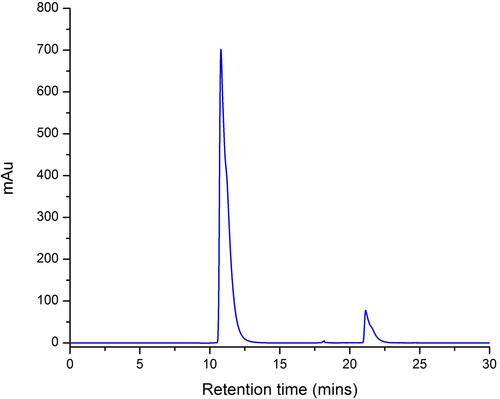
Figure 4 Biodistribution profile (%injected dose per gram organ, %ID/g organ) of 99mTc-DCN in healthy mice.
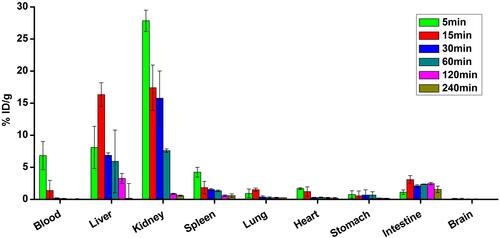
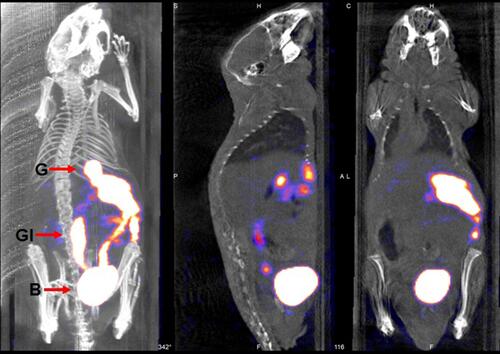
Figure 5 SPECT/CT images of 99mTc-DCN in a healthy mouse at 1 h p.i. Middle: sagittal position; Right, coronal position.