Figures & data
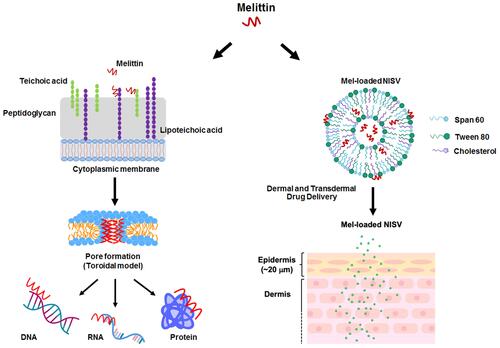
Figure 1 The proposed mechanism of Mel on bacterial cells. The possible mechanisms of most antimicrobial peptides (AMPs) target cell membranes through the negatively charged bacterial cell envelopes. Mel-induced pore formation is based on a toroidal model. Apart from the membrane destruction, the peptides may exert antibacterial activity by interactions with intracellular targets, which can be DNA, RNA and proteins, thus disrupting intracellular processes.
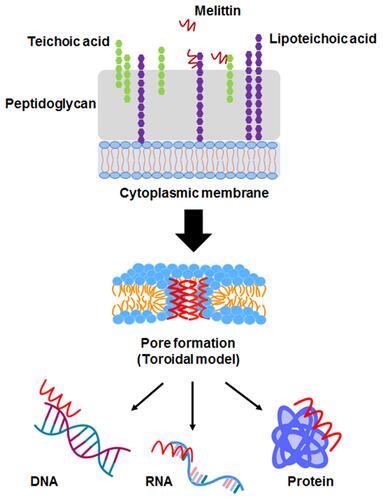
Table 1 Compositions of Different NISV Formulations
Figure 2 Schematic representation of a Mel-loaded NISV.
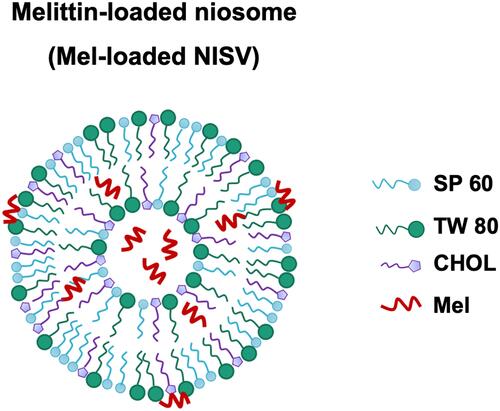
Table 2 Minimum Inhibitory Concentration (MIC) and Minimum Bactericidal Concentration (MBC) of Mel Against Skin Pathogenic Bacteria
Figure 3 Time-kill kinetics of Mel against S. aureus ATCC 25923, MRSA ATCC 43300, and VISA-4, -36 and -87. The microorganisms were treated with Mel at 0.5× or 1× MIC. The viability of bacteria was measured at the indicated time points. Data are represented as the mean ± SEM of three independent experiments performed in triplicate. *p<0.05, significant between 0.5× MIC and control, #p<0.05, significant between 1× MIC and control.
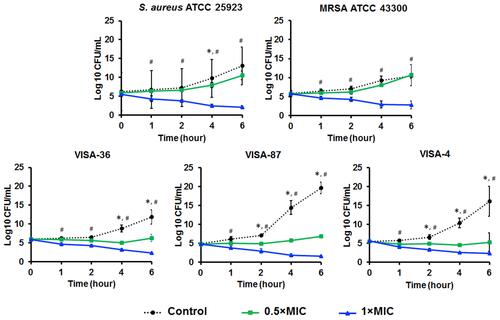
Figure 4 Localization of FITC-labeled Mel on VISA-87. Approximately 107 CFU of VISA-87 were incubated with FITC-labeled Mel at 1× MIC (green) for 30 minutes. The bacteria were washed and stained with DAPI (blue). Images were taken using a CLSM.
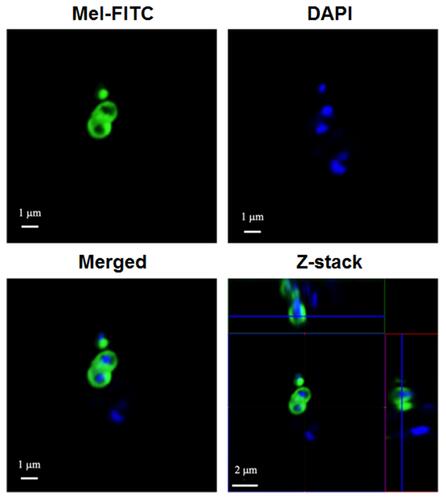
Figure 5 Membrane-targeting property of Mel. The effect of Mel on bacterial membrane integrity was investigated by PI staining. The tested bacteria (S. aureus ATCC 25923, MRSA 43300 and VISA-87) were treated with Mel corresponding to 0.5× MIC or 1× MIC for 30 minutes. (A) Bacterial cells were then stained with PI and (B) the fluorescence intensity was measured at 617 nm. Data are represented as the mean ± SEM of three independent experiments performed in triplicate. *p<0.05 as determined by one-way analysis of variance. Scale bar represents 10 μm.
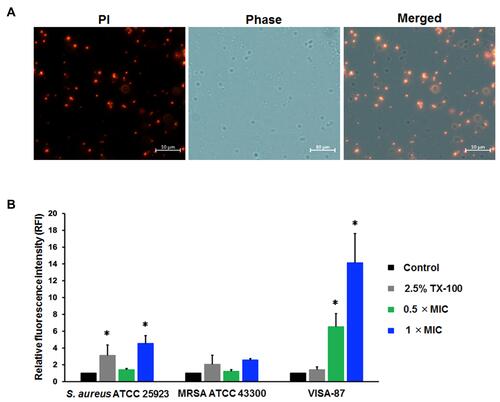
Table 3 Particle Size, Polydispersity Index (PDI), ζ Potential (ZP) and Entrapment Efficiency (EE) of NISV Formulations
Figure 6 Characteristics of Mel-loaded NISVs from F2. (A) Morphology of empty NISV and Mel-loaded NISV images based on field emission SEM. The scale bar represents 100 nm. (B) FT-IR spectra of Mel, empty NISVs and Mel-loaded NISVs. (C) In vitro release profile of Mel from NISVs at 37°C, at pH 5.5 and pH 7.4 for 48 hours. Data are represented as the mean ± SEM of three independent trials.
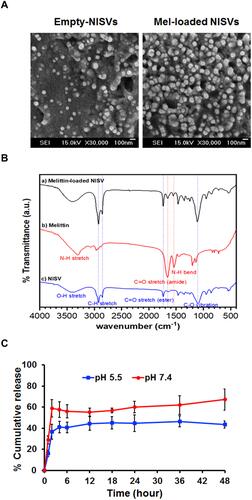
Figure 7 Live cell imaging using holotomography of A375 cells treated with Mel-loaded NISVs from F2. (A) XY image and (B) 3D rendered holotomographs of FITC-labeled Mel (green) loaded into niosomes. The formulation was labeled with lipophilic NR (red) for 4 hours. The cellular nuclei were counterstained by DAPI (blue).
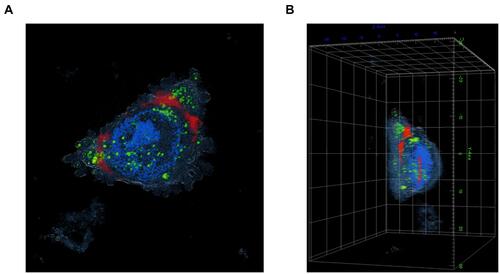
Figure 8 In vitro cytotoxicity study and antibacterial activity of Mel-loaded NISVs. (A) Investigation of cytotoxicity of empty NISVs on NIH-3T3 and A375 cells. The cells were treated with various dilutions of empty NISVs and cell viability was evaluated by the MTT assay. (B–D) Mel-loaded NISVs inhibited the growth of S. aureus ATCC 25923, MRSA ATCC 43300 and VISA-87. Bacterial cells were treated with empty NISVs or Mel-loaded NISVs at the indicated dilutions for 24 hours. These dilutions were diluted from the stock that approximately equaled 690.10±38.58 μg/mL. Bacterial growth was determined by CFU counting. Results represent the mean ± SEM from three independent experiments performed in triplicate. *p<0.05, significant compared to control; #p<0.05, significant compared to empty NISVs.
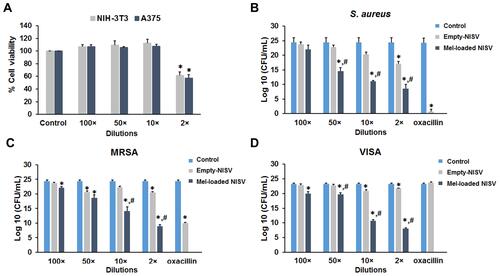
Figure 9 Histological images of porcine ear skin. (A) Differentiation of the epidermis and dermis compartment was carried out by PAS staining. The basement membrane region in the porcine ear skin is illustrated, and the epidermis and dermis layers of the skin section are indicated. The scale bar represents 20 μm. (B) Ex vivo penetration study at 2 and 4 hours post-application of Mel-loaded NISVs in a porcine skin model. The FITC-labeled Mel (green) was formulated and NISV formulation was labeled with NR (red). The overlay fluorescence images demonstrated the penetration of Mel-loaded NISVs into the skin (yellow). The cellular nuclei were counterstained by DAPI (blue). The scale bar represents 100 μm. (C) Orthogonal imaging analysis was performed to confirm the localization of Mel-loaded NISVs in the skin tissue (yellow). The depth of Mel-loaded NISV permeation reached up to 820 μm after 4 hours’ incubation.
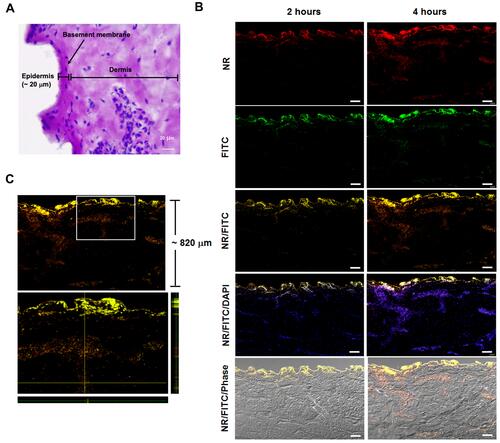
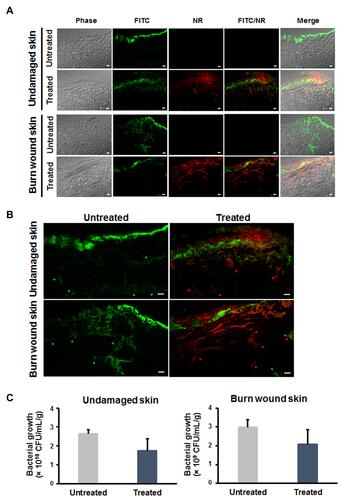
Figure 10 Inhibitory effect of Mel-loaded NISVs on S. aureus-infected skin models. (A) Undamaged and wound skin models were infected with FITC-labeled S. aureus (green) for 20 hours, followed by 4 hours’ treatment with Mel-loaded NISVs (red). The results were observed by CLSM. The scale bar represents 50 μm. Spreading of S. aureus infection (green arrowheads) in (B) undamaged and wound skin sections. Reduction of bacterial growth was found in Mel-loaded NISV treatment (red arrowheads). (C) Bacterial quantification of undamaged and wound skin infection. The scale bar represents 50 μm. The number of bacteria in the treated skin sample was determined by CFU count compared to the untreated skin (n=3).