Figures & data
Figure 1 Characterization of flake-shell SiO2 nanoparticles. (A) Field-emission scanning electron microscopy image. (B) Scanning transmission electron microscopic image. (C) Nitrogen adsorption-desorption isotherms.
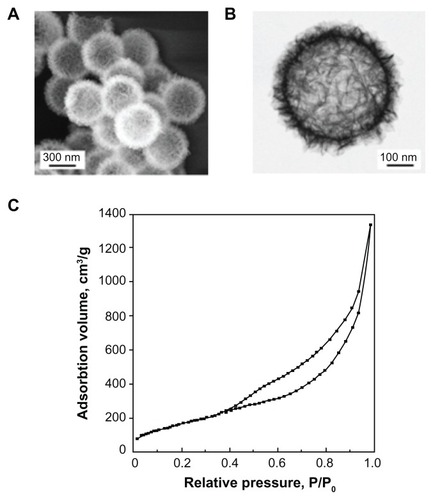
Table 1 Surface charge and maximum loading capacity of CpG ODNs on SiO2 nanoparticles coated with PEIs of different number-average molecular weights
Figure 2 Characterization of flake-shell SiO2 nanoparticles coated with PEI-600, PEI-1800, and PEI-10,000. (A) Scanning transmission electron microscopic images of flake-shell SiO2 nanoparticles before and after coating with PEI. (B) Particle size distribution of flake-shell SiO2 nanoparticles measured using dynamic light scattering. The polydispersity index was 0.26 for the SiO2 nanoparticles without PEI. The polydispersity index was 0.36, 0.37, and 0.13 for PEI-600, PEI-1800, and PEI-10,000, respectively. (C) Thermogravimetric analysis of flake-shell SiO2 nanoparticles coated with PEI. (D) N2 adsorption-desorption isotherms of flake-shell SiO2 nanoparticles after coating with PEI.
Abbreviation: PEI, polyethyleneimine.
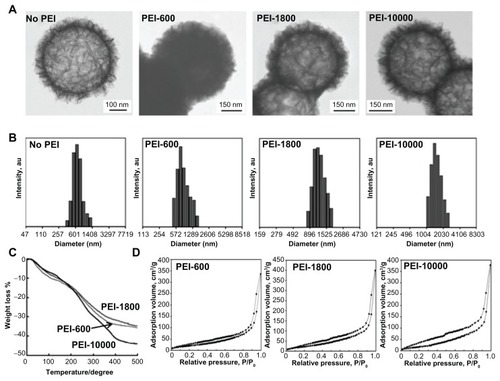
Figure 3 Cytotoxicity of PEI-coated SiO2 nanoparticles. Relative cell viability of smooth-surfaced (A) and flake-shell (B) SiO2 nanoparticles coated with PEI of Mns 600, 1800, and 10,000. Peripheral blood mononuclear cells were exposed to PEI-coated SiO2 nanoparticles at various concentrations for 48 hours.
Abbreviations: PEI, polyethyleneimine, NPs, nanoparticles; Mn, number-average molecular weight.
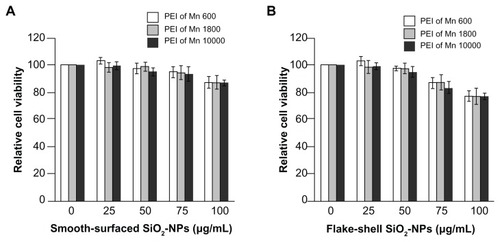
Figure 4 Loading capacity of CpG ODN2006×3-PD on SiO2 nanoparticles. Loading capacity of CpG ODN2006×3-PD on smooth-surfaced SiO2 nanoparticles (A) and flake-shell SiO2 nanoparticles (B) coated with polyethyleneimine of Mns 600, 1800, and 10,000. CpG ODN2006×3-PD solutions (46 μL) of various concentrations were incubated with 40 μg of SiO2 nanoparticles coated with polyethyleneimine.
Abbreviations: PEI, polyethyleneimine; NPs, nanoparticles; Mn, number-average molecular weight; ODN, oligodeoxynucleotides.
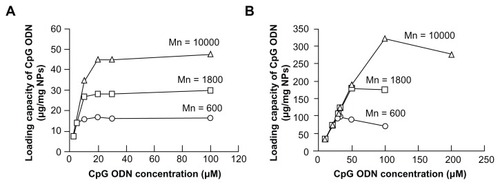
Figure 5 IFN-α induction by CpG ODNs in peripheral blood mononuclear cells. (A) IFN-α induction by free CpG ODN2006×3-PD and CpG ODN2216. Free class A CpG ODN2216 induced IFN-α in a dose-dependent manner, but free CpG ODN2006×3-PD did not induce IFN-α. (B) IFN-α induction by CpG ODN2006×3-PD loaded on SiO2 nanoparticles. Naked smooth-surfaced and flake-shell SiO2 nanoparticles did not induce IFN-α, but CpG ODN2006×3-PD loaded on smooth-surfaced and flake-shell SiO2 nanoparticles coated with PEI induced IFN-α. The SiO2 nanoparticles loaded with CpG ODN2006×3-PD were applied to peripheral blood mononuclear cells at a concentration of 50 μg/mL. The concentrations of CpG ODN2006×3-PD on smooth-surfaced SiO2 nanoparticles coated with PEI of Mns 600, 1800, and 10,000 were estimated to be 33, 62, and 98 pmol/mL medium, respectively, from the loading capacities. Similarly, the concentrations of CpG ODN2006×3-PD on flake-shell SiO2 nanoparticles coated with PEI of Mns 600, 1800, and 10,000 were estimated to be 196, 364, and 650 pmol/mL medium, respectively.
Abbreviations: PEI, polyethyleneimine, NPs, nanoparticles; Mn, number-average molecular weight; ODN, oligodeoxynucleotides; IFN-α, interferon alpha.
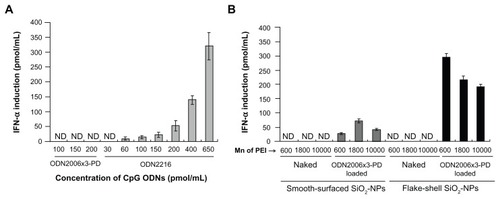
Figure 6 IFN-α induction by the same density of CpG ODN2006×3-PD on flake-shell SiO2 nanoparticles coated with PEI of Mns 600, 1800, and 10,000. The loading amount of CpG ODN2006×3-PD was about 100 μg/mg nanoparticles (200 pmol/mL medium), which is similar to the maximum loading capacity of flake-shell SiO2 nanoparticles coated with PEI of Mn 600. The flake-shell SiO2 nanoparticles loaded with CpG ODN2006×3-PD were applied to peripheral blood mononuclear cells at a concentration of 50 μg nanoparticles/mL. The SiO2 nanoparticles coated with PEI of Mns 1800 and 10,000 showed a significantly lower level of IFN-α induction despite having the same density of CpG ODN2006×3-PD as the SiO2 nanoparticles coated with PEI of Mn 600.
Abbreviations: PEI, polyethyleneimine, NPs, nanoparticles; Mn, number-average molecular weight; ODN, oligodeoxynucleotides; IFN-α, interferon alpha.
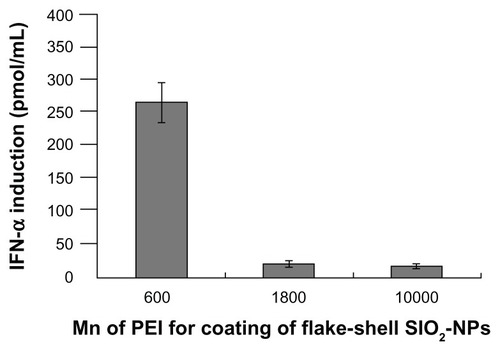
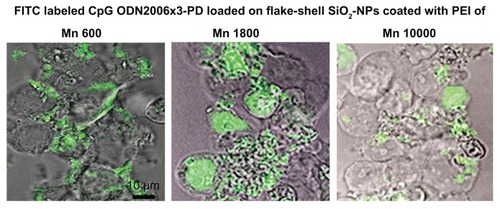
Figure 7 Intracellular localization of CpG ODN2006×3-PD delivered by flake-shell SiO2 nanoparticles coated with PEI of Mns 600, 1800, and 10,000. FITC-labeled CpG ODN2006×3-PD was loaded on the SiO2 nanoparticles through PEI.
Notes: The loading amount of FITC-labeled CpG ODN2006×3-PD was approximately 100 μg/mg nanoparticles, and the SiO2 nanoparticles were applied to the cells at a concentration of 50 μg/mL. Each image was obtained from a cross-section of cells using confocal laser fluorescence microscopy. Bar = 10 μm.
Abbreviations: FITC, fluorescein isothiocyanate; PEI, polyethyleneimine, NPs, nanoparticles; Mn, number-average molecular weight; ODN, oligodeoxynucleotides.