Figures & data
Table 1 Particle size and zeta potential of ZnO nanoparticles
Figure 1 SEM (A and C) and TEM (B and D) images of 20 nm and 70 nm ZnO nanoparticles, respectively. XRD patterns (E) for pristine 20 nm (A), pristine 70 nm (B), citrate-modified 20 nm (C), and citrate-modified 70 nm (D) nanoparticles.
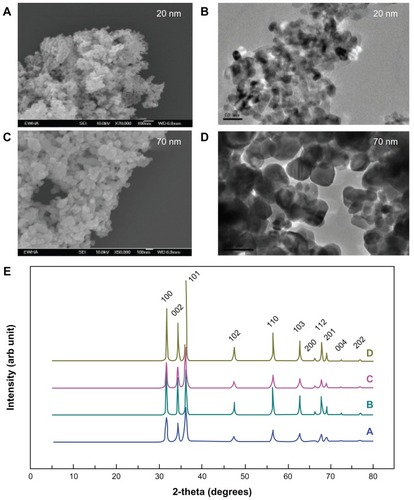
Figure 2 Body weight gain in male (A and C) and female (B and D) rats treated with 20 nm and 70 nm ZnO nanoparticles, respectively.
Note: The data show no significant difference from the control group (P < 0.05).
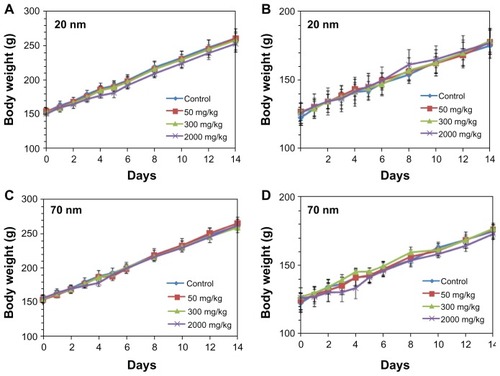
Figure 3 Plasma concentrations of ZnO nanoparticles after single-dose oral administration in male (A and C) and female (B and D) rats.
Notes: ZnO nanoparticle levels were measured by ICP-AES. The data are presented as increased zinc levels after subtraction of the basal zinc level in the control group. Insert: higher magnification of plasma concentration-time curve for the 50 mg/kg dose.
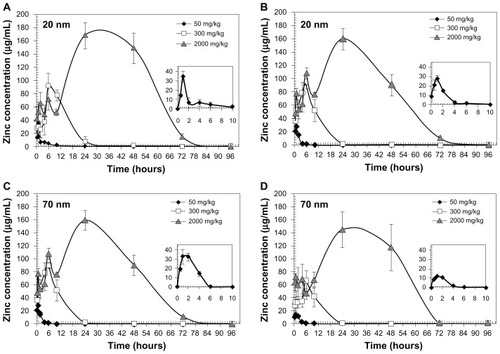
Table 2 Pharmacokinetic parameters of different-sized ZnO nanoparticles in rats
Table 3 Absorption of different-sized ZnO nanoparticles in rats
Figure 4 Tissue distribution of ZnO nanoparticles in rats after single-dose oral administration of 2000 mg/kg 20 nm and 70 nm in male (A and C) and female (B and D) rats, respectively.
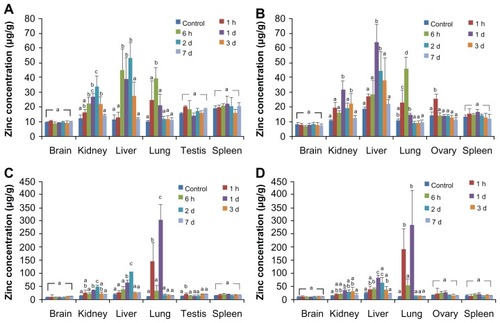
Table 4 Tissue distribution of different-sized ZnO nanoparticles
Figure 5 TEM images of the liver and kidney collected 24 hours after oral administration with two different-sized ZnO nanoparticles.
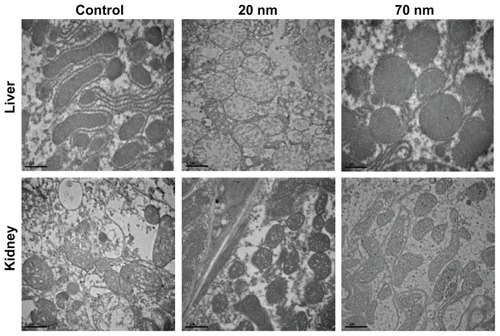
Figure 6 Fourier transform XAS spectra (radial distribution function) for 20 nm ZnO nanoparticles before oral administration (A), and liver (B), kidney (C), and spleen (D) at 24 hours after oral administration.
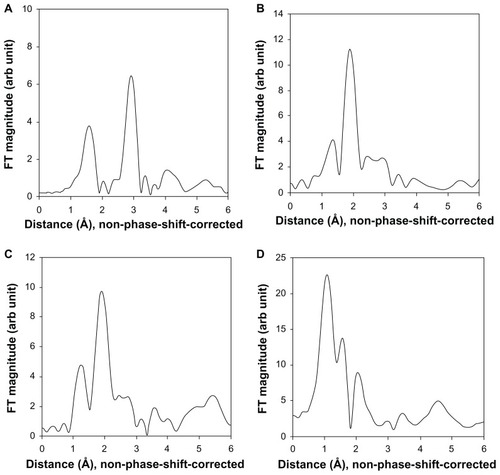
Figure 7 Excretion profile of 20 and 70 nm ZnO nanoparticles via urine and feces; 20 nm and 70 nm ZnO nanoparticles in urine in male (A and C) and female (B and D) rats, respectively; 20 nm and 70 nm ZnO nanoparticles in feces in male (E and G) and female (F and H), respectively.
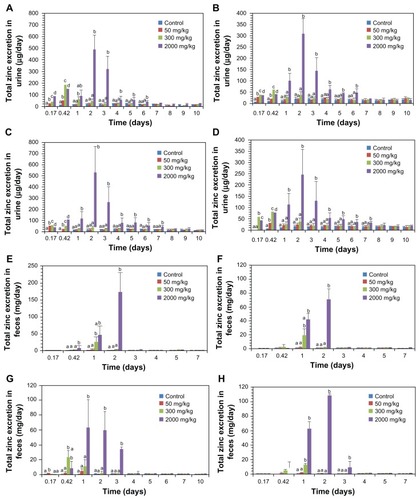
Table 5 Excretion values of different-sized ZnO nanoparticles via urine and feces in rats
Figure S1. Tissue distribution of ZnO nanoparticles in rats after single dose oral administration of 50 mg/kg and 300 mg/kg. 50 mg/kg and 300 mg of 20 nm in male (A and B) and female (C and D). 50 mg/kg and 300 mg of 70 nm in male (E and F) and female (G and H) rats, respectively.
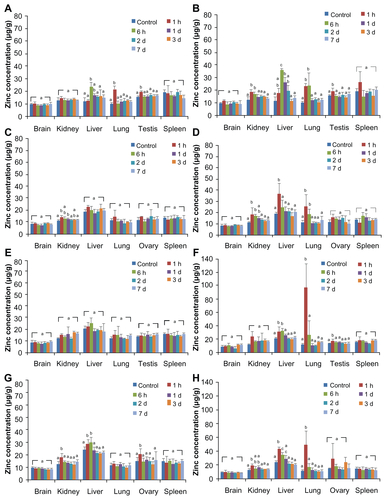
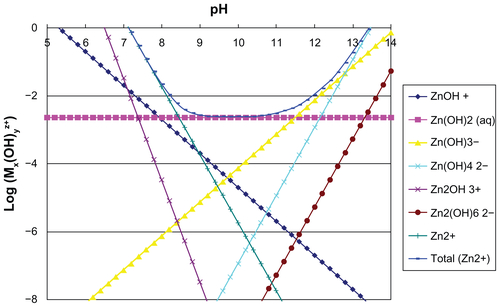
Figure S2. Solubility diagram of zinc cations in aqueous solution with respect to pH.