
Figures & data
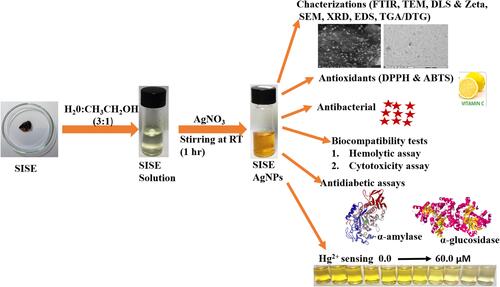
Scheme 1 Schematics of SISE AgNPs synthesis, for diverse biological applications and Hg2+ sensing.
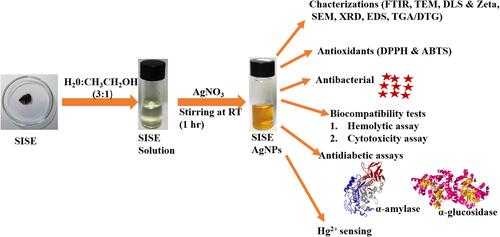
Figure 1 UV-V is absorption spectra of SISE AgNPs synthesis under different concentrations of AgNO3, (a) SISE (b) 1.0 (c) 2.0 (d) 3.0 (e) 4.0 (f) 5.0 mM, inset shows the photo images.
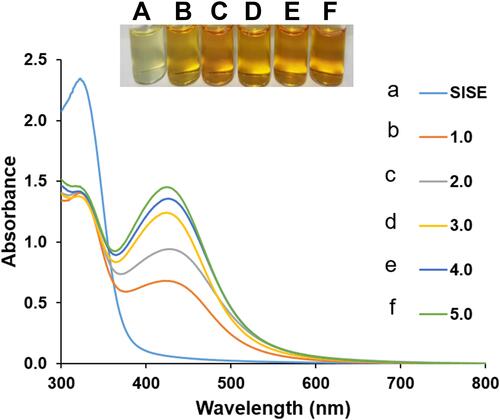
Figure 2 Mechanism of SISE AgNPs synthesis, using Eriodyctiol as a putative bioactive metabolite from SISE.
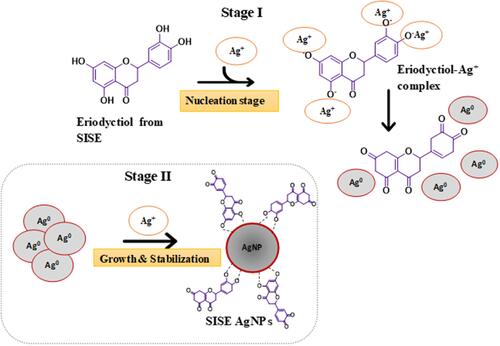
Figure 3 (A) FTIR of (a) SISE (b) SISE AgNPs (B) TEM (200 nm) (C) TEM (50 nm) (D) Hydrodynamic diameter from DLS (E) FESEM (F) XRD of SISE AgNPs.
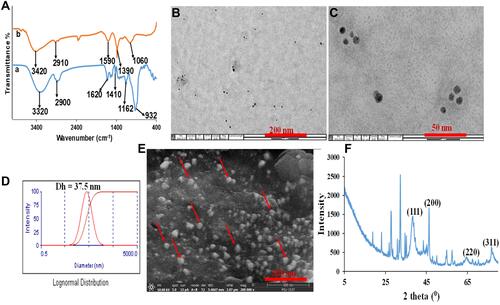
Figure 4 (A) DPPH radical scavenging and (B) ABTS activity of SISE AgNPs, in comparison with standard Ascorbic acid (AA).
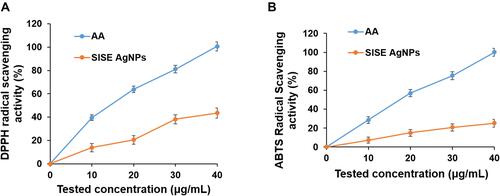
Table 1 Antimicrobial Activity of SISE AgNPs
Figure 5 (A) Effects of SISE AgNPs on erythrocyte hemolysis and (B) Cytotoxicity effects of SISE AgNPs on the viability of mouse fibroblast cells (L-929) and human embryonic colon cells (CaCo-2) at different concentration (0.209–26.875 μg/mL). Error bars represent the standard deviation of two measurements.
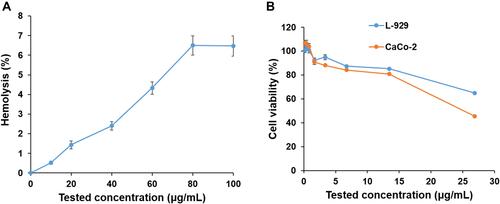
Figure 6 In vitro antidiabetic potentials of SISE AgNPs on (A) α-amylase and (B) α-glucosidase.
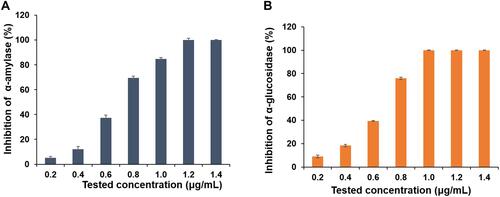
Figure 7 (A) UV-V is absorption spectra of SISE AgNPs, in the presence of Hg2+ ranging from 0.0–60.0 μM, inset shows the photo images of the various concentrations and (B) Plot of absorbance ratio A385/A423 against Hg2+ concentrations.
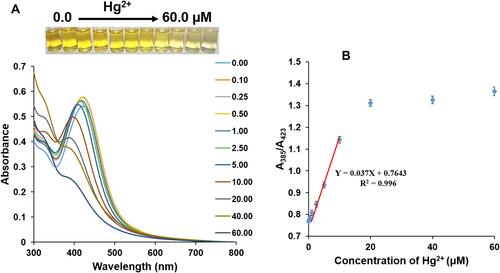
Figure 8 (A) Mechanistic basis of Hg2+ interaction with SISE AgNPs and (B) TEM images of (a) SISE AgNPs in the absence and (b) in the presence of 20.0 μM Hg2+ inset shows the photo images.
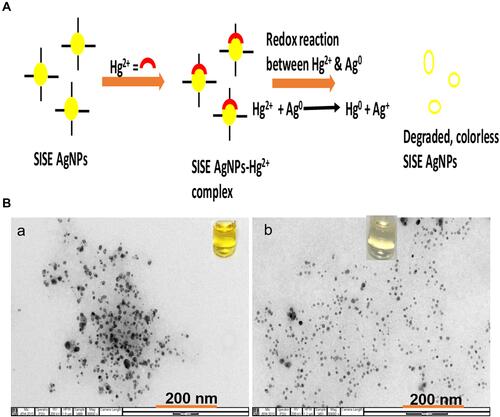
Table 2 Real Sample Application of SISE AgNPs Towards Hg2+ Detection in Water, (n = 3)