Figures & data
Figure 1 Cell growth inhibition efficacy of the drug formulations on EC9706 cells after incubation for 24, 48, and 72 hours.
Notes: The equivalent PTX concentrations were 0.01, 0.1, 1, 10, and 100 μg/mL. Data are presented as the mean ± standard deviation.
Abbreviations: PTX, paclitaxel; M(PTX), paclitaxel-loaded micelles; FA-M(PTX), folate-targeted, paclitaxel-loaded micelles.
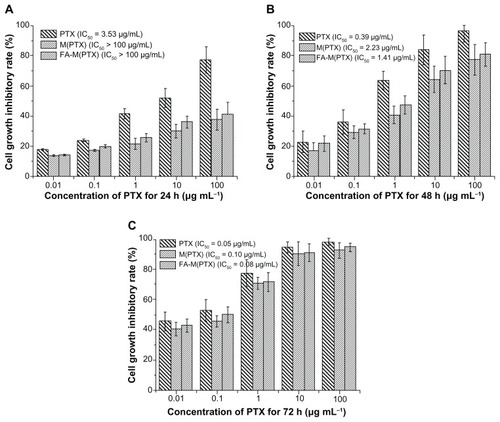
Figure 2 Apoptosis of EC9706 cells detected by flow cytometry at 24, 48, and 72 hours.
Notes: At 24 hours, #P < 0.01 versus controls, there was no significant difference between the treatment groups. At 48 hours, #P < 0.01 versus controls; *P < 0.05, compared with FA-M(PTX). At 72 hours, #P < 0.01, versus controls; ▲P < 0.01, versus FA-M(PTX).
Abbreviations: PTX, paclitaxel; M(PTX), paclitaxel-loaded micelles; FA-M(PTX), folate-targeted, paclitaxel-loaded micelles.
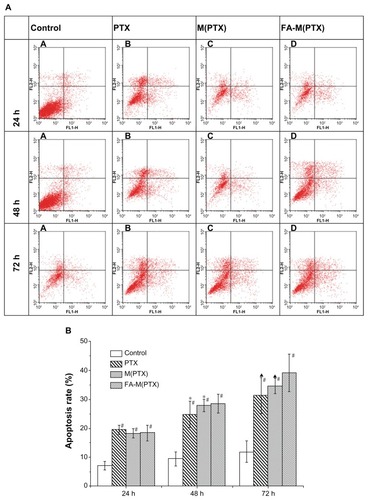
Figure 3 (A) CLSM images and flow cytometry analysis of EC9706 cells incubated with free RhB (a), M(RhB) (b) and FA-M(RhB) (c) in folic acid-free RMPI 1640 medium, respectively; (d and e) represent EC9706 cells incubated with M(RhB) and FA-M(RhB) in RMPI 1640 medium containing 1 mM of folic acid, respectively. (B) Statistical data for cellular uptake obtained by flow cytometry.
Note: *P < 0.05 versus group A.
Abbreviations: CLSM, confocal laser scanning microscopy; PTX, paclitaxel; M(PTX), paclitaxel-loaded micelles; FA-M(PTX), folate-targeted, paclitaxel-loaded micelles; FCM, flow cytometry; RhB, rhodamine B.
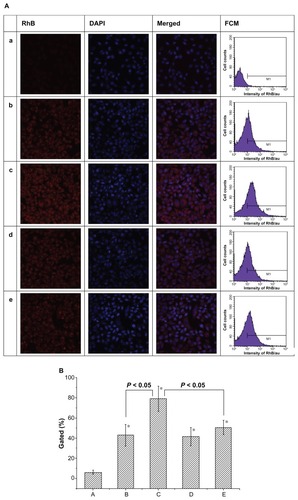
Figure 4 Volume change in xenograft tumors as a function of time.
Abbreviations: PTX, paclitaxel; M(PTX), paclitaxel-loaded micelles; FA-M(PTX), folate-targeted, paclitaxel-loaded micelles.
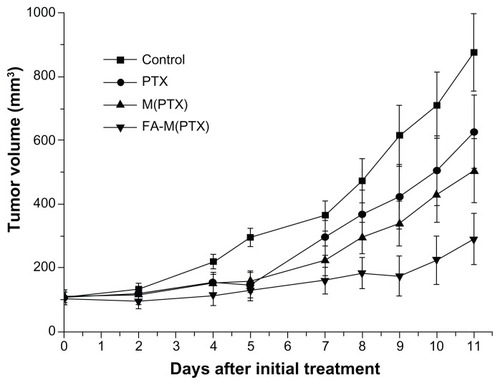
Figure 5 Excised xenograft tumors on day 12 after initial treatment. (A) controls, (B) paclitaxel, (C) paclitaxel-loaded micelles, and (D) folate-targeted, paclitaxel-loaded micelles.
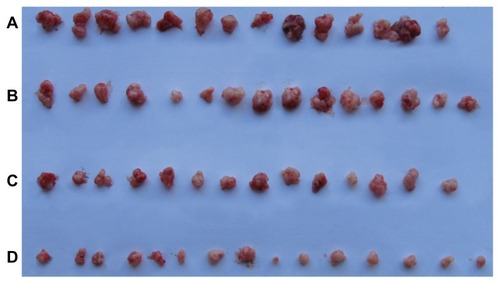
Table 1 Mean ± standard deviation for volume and net weight of EC9706 xenograft tumors on day 12 after initial treatment
Figure 6 Apoptosis of the xenograft tumors detected by flow cytometry on day 12 after initial treatment. (A) controls, (B) paclitaxel, (C) paclitaxel-loaded micelles, and (D) folate-targeted, paclitaxel-loaded micelles.
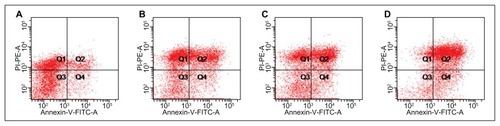
Figure 7 (A) Apoptosis detected by TUNEL and expression of caspase 3, Bax, and Bcl2 detected by immunohistochemistry in xenograft tumors. (a) Controls, (b) PTX, (c) M(PTX), and (d) FA-M(PTX). (B) For TUNEL, #P < 0.05 versus controls; *P < 0.05 versus FA-M(PTX); P = 0.648, PTX versus M(PTX). For caspase 3, #P < 0.01 versus controls; *P < 0.01 versus FA-M(PTX); P = 0.269, PTX versus M(PTX). For Bax, #P < 0.05, versus controls; *P < 0.05 versus FA-M(PTX); P = 0.859, PTX versus M(PTX). For Bcl-2, #P < 0.05 versus controls.
Abbreviations: n, number of mice; PTX, paclitaxel; M(PTX), paclitaxel-loaded micelles; FA-M(PTX), folate-targeted, paclitaxel-loaded micelles.
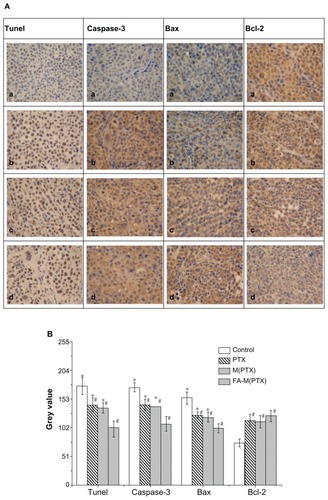
Figure 8 Tumor slices stained with hematoxylin and eosin. The slices were prepared from the margin of xenografts, and the necrotic area in the FA-M(PTX) group is significantly increased compared with that of the other groups. Straight arrows: tissue necrosis; curved arrows: macrophages; swallowtail arrows: lymphocytes. (A) Control, (B) PTX (C) M(PTX), and (D) FA-M(PTX).
Abbreviations: PTX, paclitaxel; M(PTX), paclitaxel-loaded micelles; FA-M(PTX), folate-targeted, paclitaxel-loaded micelles.
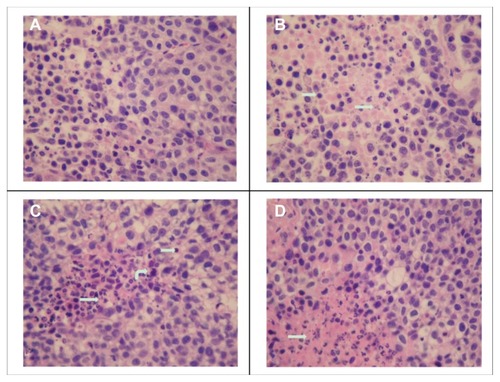
Table 2 Median and mean survival times for nude mice
Figure 9 (A) Tumor volume change as a function of time after initial treatment in survival analysis; (B) Kaplan-Meier survival curves of human esophageal cancer xenograftbearing nude mice.
Abbreviations: PTX, paclitaxel; M(PTX), paclitaxel-loaded micelles; FA-M(PTX), folate-targeted, paclitaxel-loaded micelles
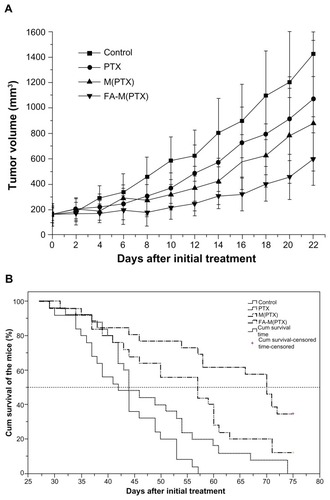
Table S1 Characteristics of M(PTX) and FA-M(PTX)