Figures & data
Figure 1 TEM images of FePt NPs synthesized with different Fe/Pt molar ratios and surface coatings.
Notes: (A) Fe:Pt = 3:1, OA/OA; (B) Fe:Pt = 1:1, OA/OA; (C) Fe:Pt = 1:3, OA/OA; (D) Fe:Pt = 1:1, Cys; (E) Fe:Pt = 1:3, Cys.
Abbreviations: TEM, transmission electron microscopy; NPs, nanoparticles; OA/OA, oleic acid/oleylamine; Cys, cysteine.
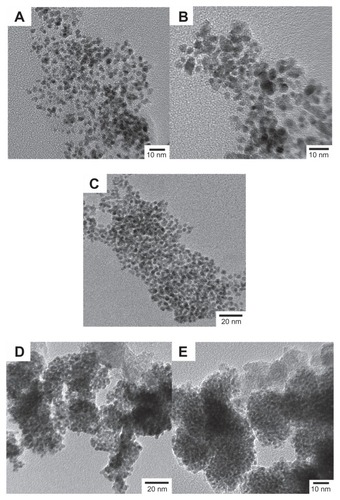
Table 1 Compositions and sizes of FePt NPs synthesized at different Fe/Pt ratios and surface coatings
Figure 2 XRD patterns of FePt NPs synthesized at different Fe/Pt molar ratios and with different surface coatings.
Notes: (A) Fe:Pt = 3:1, OA/OA; (B) Fe:Pt = 1:1, OA/OA; (C) Fe:Pt = 1:3, OA/OA; (D) Fe:Pt = 1:1, Cys; (E) Fe:Pt = 1:3, Cys.
Abbreviations: XRD, X-ray diffraction; NPs, nanoparticles; OA/OA, oleic acid/oleylamine; Cys, cysteine.
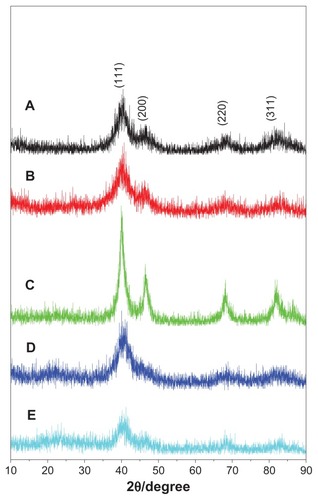
Figure 3 XPS spectra of Pt and Fe elements in the FePt NPs synthesized at different Fe/Pt molar ratios and with different surface coatings.
Notes: (A) Fe60Pt40-OA/OA; (B) Fe45Pt55-OA/OA; (C) Fe27Pt73-OA/OA; (D) Fe60Pt40-Cys; (E) Fe24Pt76-Cys.
Abbreviations: XPS, X-ray photon spectroscopy; OA/OA, oleic acid/oleylamine; Cys, cysteine.
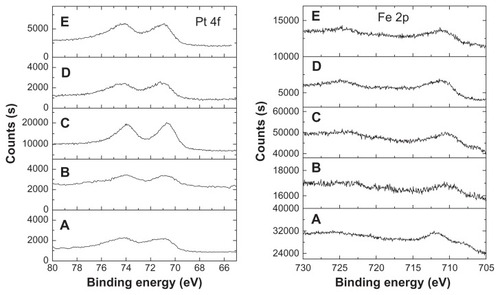
Figure 4 FTIR spectra of FePt NPs synthesized with different surface coatings and components.
Notes: (A) Fe60Pt40-OA/OA; (B) Fe45Pt55-OA/OA; (C) Fe27Pt73-OA/OA; (D) oleylamine; (E) oleic acid; (F) Fe60Pt40-Cys; (G) Fe24Pt76-Cys; (H) cysteine.
Abbreviations: FTIR, Fourier transform infrared spectroscopy; NPs, nanoparticles; OA/OA, oleic acid/oleylamine.
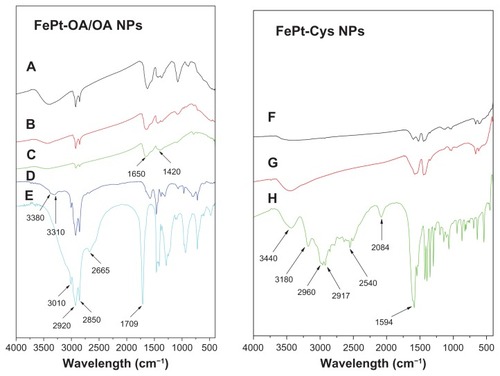
Figure 5 Cell proliferation of human glioma U251 cells treated with FePt NPs with different components and surface coatings.
Notes: (A) Fe60Pt40-OA/OA; (B) Fe45Pt55-OA/OA; (C) Fe27Pt73-OA/OA; (D) Fe60Pt40-Cys; (E) Fe24Pt76-Cys.
Abbreviations: NPs, nanoparticles; OA/OA, oleic acid/oleylamine; Cys, cysteine.
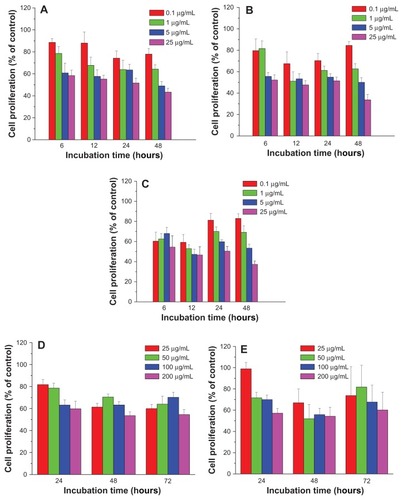
Figure 6 Cell proliferation of human astrocytoma U87 cells treated with FePt NPs with different components and surface coatings.
Notes: (A) Fe60Pt40-OA/OA; (B) Fe45Pt55-OA/OA; (C) Fe27Pt73-OA/OA; (D) Fe60Pt40-Cys; (E) Fe24Pt76-Cys.
Abbreviations: NPs, nanoparticles; OA/OA, oleic acid/oleylamine; Cys, cysteine.
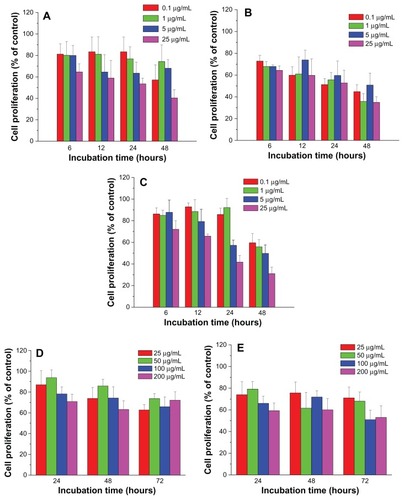
Figure 7 Cell proliferation of human neuroglioma H4 cells treated by FePt NPs with different components and surface coatings.
Notes: (A) Fe60Pt40-OA/OA; (B) Fe45Pt55-OA/OA; (C) Fe27Pt73-OA/OA; (D) Fe60Pt40-Cys; (E) Fe24Pt76-Cys.
Abbreviations: NPs, nanoparticles; OA/OA, oleic acid/oleylamine; Cys, cysteine.
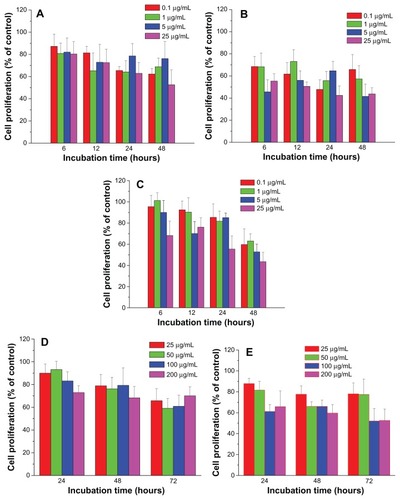
Figure 8 Representative TEM images showing the uptake of FePt NPs with different components and surface coatings by human glioma U251 cells at the exposed dose of 25 μg/mL after 24 hours’ incubation.
Notes: (A) Fe60Pt40-OA/OA; (B) Fe45Pt55-OA/OA; (C) Fe27Pt73-OA/OA; (D) Fe60Pt40-Cys; (E) Fe24Pt76-Cys. Numerous vesicles containing the aggregative FePt NPs were visible intracellularly and were dispersed randomly in the cytoplasm. The insets in panels (A and B) are enlargements of the areas marked in white, showing the aggregative FePt NPs contained in the vesicles. The inset in panel (E) is the enlargement of the area marked in white, showing the formation of a vesicle containing an aggregate of FePt NPs.
Abbreviations: TEM, transmission electron microscopy; NPs, nanoparticles; OA/OA, oleic acid/oleylamine; Cys, cysteine.
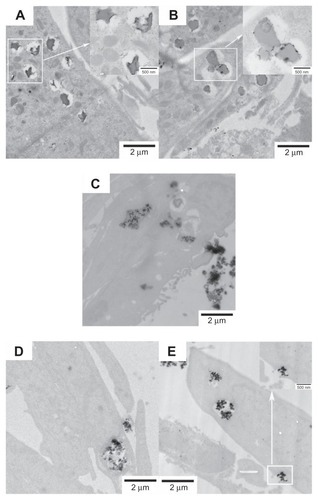
Figure 9 Representative TEM images showing the uptake of FePt NPs with different components and surface coatings by human astrocytoma U87 cells at the exposed dose of 25 μg/mL after 24 hours’ incubation.
Notes: (A) Fe60Pt40-OA/OA; (B) Fe45Pt55-OA/OA; (C) Fe27Pt73-OA/OA; (D) Fe60Pt40- Cys; (E) Fe24Pt76-Cys. The release and diffusion of FePt NPs from the vesicles into the cytoplasm were observed and are marked with white arrows in panel (A); the penetration of FePt NPs through the nuclear membrane was shown and is marked with white arrows in panel (B). The adsorption of FePt NPs on the surface of cellular membrane was shown and is marked with a white arrow in panel (D).
Abbreviations: TEM, transmission electron microscopy; NPs, nanoparticles; OA/OA, oleic acid/oleylamine; Cys, cysteine.
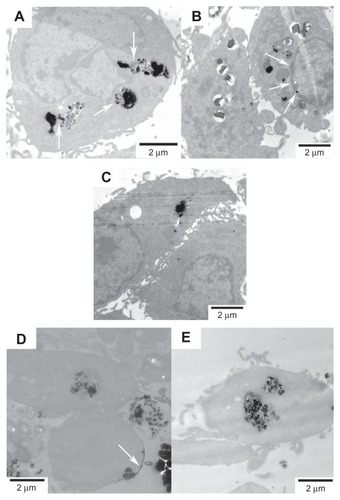
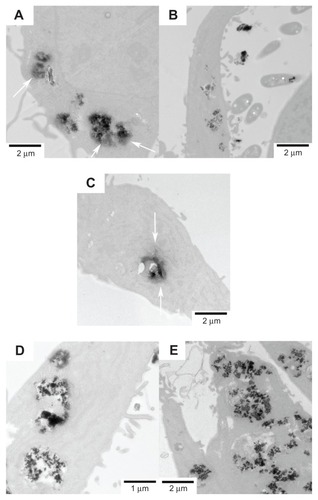
Figure 10 Representative TEM images showing the uptake of FePt NPs with different components and surface coatings by human neuroglioma H4 cells at the exposed dose of 25 μg/mL after 24 hours’ incubation.
Notes: (A) Fe60Pt40-OA/OA; (B) Fe45Pt55-OA/OA; (C) Fe27Pt73-OA/OA; (D) Fe60Pt40- Cys; (E) Fe24Pt76-Cys. The release and diffusion of FePt NPs from the vesicles into the cytoplasm were observed and are marked with white arrows in panels (A and B).
Abbreviations: TEM, transmission electron microscopy; NPs, nanoparticles; OA/OA, oleic acid/oleylamine; Cys, cysteine.