Figures & data
Figure 1 Contact angle investigation of surface polarity.
Notes: The mean contact angles of the four tissue culture surfaces indicated differences. Error bars show the standard deviation. The contact angle on Aclar was significantly different than on the other three surfaces (analysis of variance, followed by Tukey’s test, max P = 0.017).
Abbreviations: PLL Aclar, poly-L-lysine-functionalized planar Aclar; PLL glass, poly-L-lysine-functionalized planar glass.
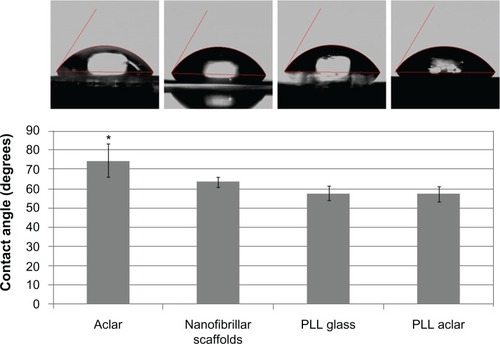
Figure 2 AFM surface roughness investigation of scaffolds. High-resolution AFM deflection images of (A) nanofibrillar scaffold, (B) PLL glass, (C) Aclar, and (D) PLL Aclar by an A scanner RMS surface roughness measurement results (E) of nanofibrillar scaffolds, along nanofibers, PLL glass, Aclar, and PLL Aclar.
Notes: Scale bars, 250 nm. The mean RMS surface roughness measurements showed that nanofibrillar scaffolds had the highest surface roughness but surface roughness along individual nanofibers was comparable to the planar surfaces (inset). Error bars show the standard deviation.
Abbreviations: AFM, atomic force microscopy; PLL Aclar, poly-L-lysine-functionalized planar Aclar; PLL glass, poly-L-lysine-functionalized planar glass; RMS, root mean square.
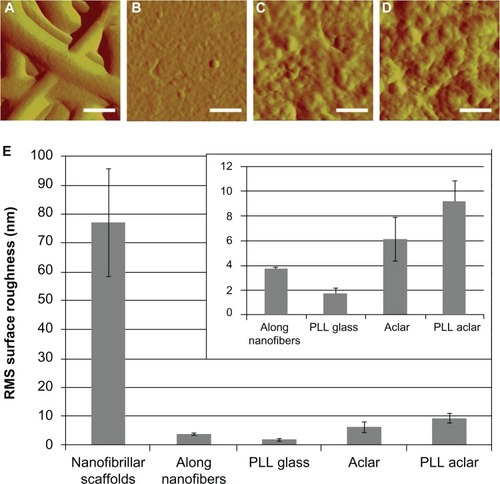
Figure 3 Differential interference contrast images of astrocytes cultured on (A) PLL glass, (B) nanofibrillar scaffolds, (C) Aclar, and (D) PLL Aclar.
Note: Scale bars, 100 μm.
Abbreviations: PLL Aclar, poly-L-lysine-functionalized planar Aclar; PLL glass, poly-L-lysine-functionalized planar glass.
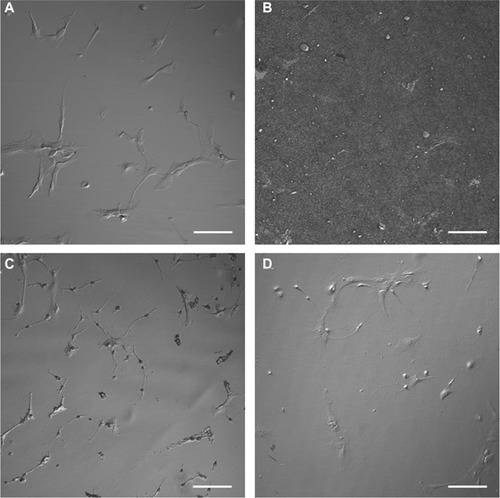
Figure 4 AFM astrocyte morphology investigation on PLL glass. (A) AFM high pass filtered composite height image of astrocytes by J scanner show lamellipodia formation (scale bar, 20 μm). (B–D) Close-ups by E scanner of arrow regions a–d shown in (A): stress fibers (B); filopodia anchors (C); and cell–cell interaction (D) (scale bars, 2 μm). (E and F) Cross-section profiles of cells e and f in (A).
Note: Axis units are in μm with astrocyte soma extent identified by red arrow.
Abbreviations: AFM, atomic force microscopy; PLL glass, poly-L-lysine-functionalized planar glass.
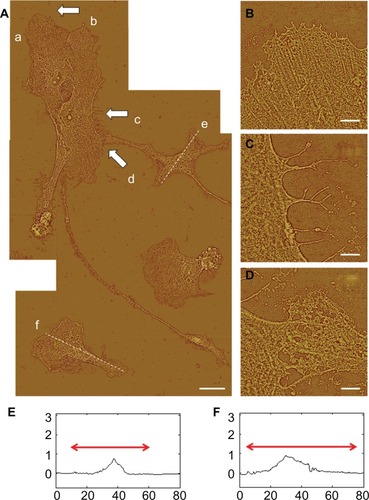
Figure 5 AFM astrocyte morphology investigation on nanofibrillar scaffolds. (A) AFM GHPF composite height image of astrocytes cultured on nanofibrillar surfaces by J scanner. Scale bar, 20 μm. (B–D) Cross section profiles of cells b–d in (A).
Note: Axis units are in μm with astrocyte soma extent identified by red arrow.
Abbreviations: AFM, atomic force microscopy; GHPF, Gaussian high pass filtering.
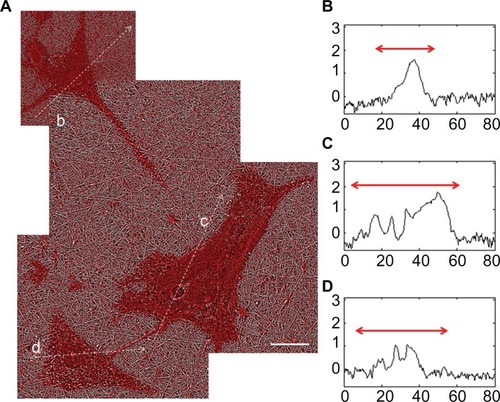
Figure 6 Atomic force microscopy high pass filtered composite height images of astrocytes cultured on nanofibrillar scaffolds by J scanner. (A) Dashed box identifies the intercellular connection. (B) Close-up of the intercelluar connection by E scanner. Dashed box identifies a contacted area. (C) Close-up of a contacted area by E scanner.
Note: The scale bars show 10, 2, and 0.5 μm in (A), (B), and (C), respectively.
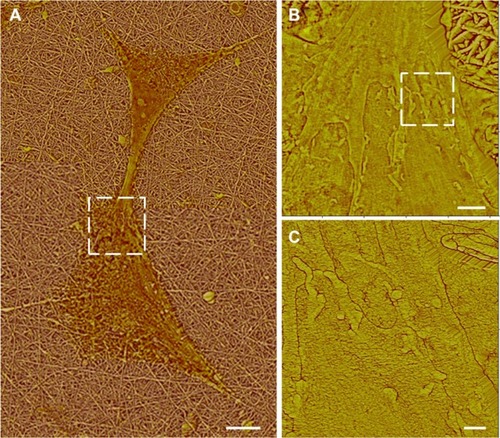
Figure 7 (A) AFM GHPF composite height image of astrocytes cultured on Aclar surfaces by J scanner. Scale bar 20 μm. (B–D) The cross sections shown by b–d in (A) were given in corresponding section profiles.
Note: Axis units are in μm.
Abbreviations: AFM, atomic force microscopy; GHPF, Gaussian high pass filtering.
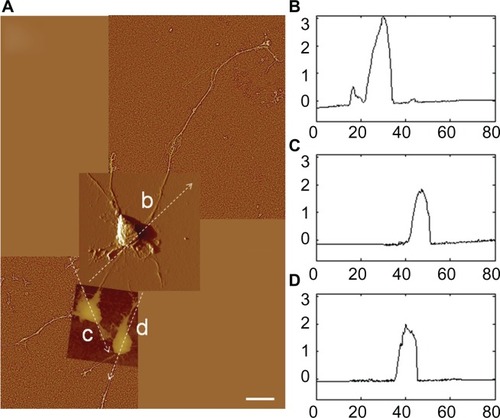
Figure 8 AFM investigation of astrocytes cultured on PLL Aclar surfaces. (A) Composite AFM deflection image of astrocytes by J scanner. Scale bar, 20 μm. (B) AFM deflection image of an astrocyte by J scanner. Scale bar, 10 μm. Dotted arrow identifies cross section. Dashed box identifies a cell edge. (C) Corresponding cross section profile. Axis units are in μm with astrocyte soma extent identified by red arrow. (D) Corresponding cell edge showing nanoscale filopodia by E scanner.
Notes: Scale bar, 2 μm.
Abbreviations: AFM, atomic force microscopy; PLL Aclar, poly-L-lysine-functionalized planar Aclar.
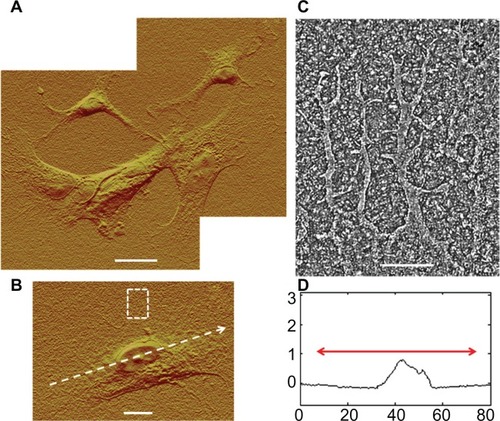
Table 1 Quantitative astrocyte stellation response results
Figure 9 Immunocytochemistry structural investigation results. Left to right: fluorescence images of astrocytes cultured on PLL glass, nanofibrillar scaffolds, Aclar, and PLL Aclar substrates. Immunnolabeling and corresponding phalloidin are represented in red and green, respectively. Astrocytes were labeled with (A) anti-Cdc42, (B) anti-Rac1, and (C) anti-RhoA.
Note: Scale bars, 10 μm.
Abbreviations: PLL Aclar, poly-L-lysine-functionalized planar Aclar; PLL glass, poly-L-lysine-functionalized planar glass.
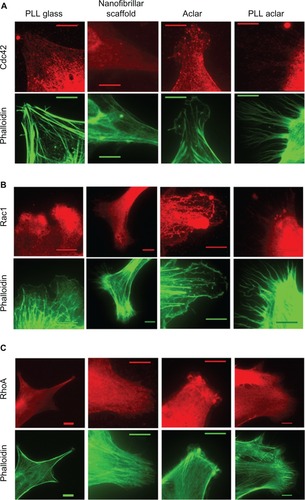
Figure 10 The white, gray, and dark gray bars show the Cdc42, Rac1, and RhoA intensities, respectively.
Notes: The data is based on maximum intensity level images. Bars show the mean, and error bars show standard error of n = 20 cells.
Abbreviations: PLL Aclar, poly-L-lysine-functionalized planar Aclar; PLL glass, poly-L-lysine-functionalized planar glass.
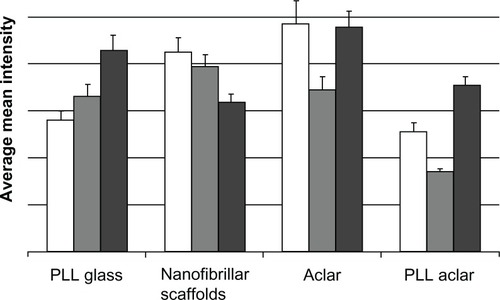
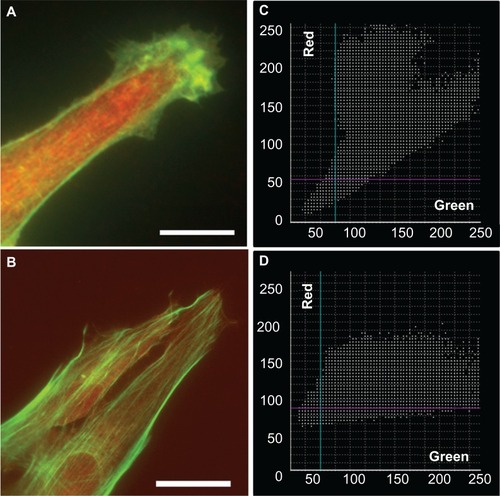
Figure 11 Overlaid fluorescence images of astrocytes cultured on nanofibrillar scaffolds (A) and PLL glass (B) labeled with phalloidin (F-actin) and anti-RhoA. The fluorescence was represented in green for F-actin and red for RhoA in (A) and (B). The scatter plots of F-actin and RhoA for nanofibrillar scaffolds (C) and PLL glass (D) showed partial colocalization with a mean PC of 0.66 and 0.58 respectively.
Note: Scale bar in (A) 10 μm, and (B) 20 μm.
Abbreviation: PLL glass, poly-L-lysine-functionalized planar glass.