Figures & data
Figure 1 1H NMR spectra of stearic acid–grafted chitosan (CS-SA) conjugate.
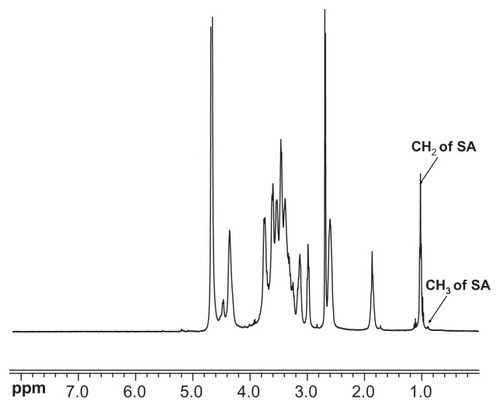
Table 1 Characteristics of CS-SA micelles and DOX loaded CS-SA micelles
Figure 2 Fluorescence intensity ratio of I1/I3 plotted against logarithm of stearic acid–grafted chitosan (CS-SA) concentration (A); transmission electron microscopy images of CS-SA micelles (B); doxorubicin loaded CS-SA micelles (C).
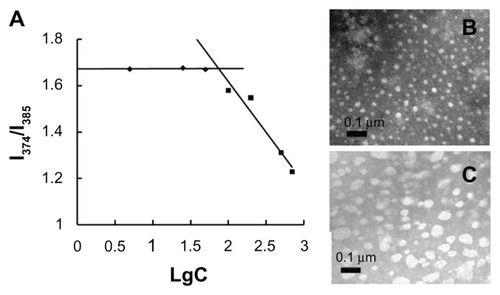
Figure 3 Fluorescence images of bEnd.3 after incubation with fluorescein isothiocyanate–labeled stearic acid–grafted chitosan micelles for 0.5, 1, 6, and 8 hours.
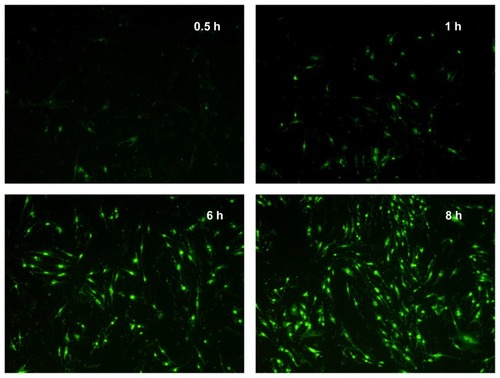
Figure 4 In vitro release profiles of doxorubicin (DOX)-loaded stearic acid–grafted chitosan (CS-SA) micelles in phosphate-buffered saline (pH 7.2).
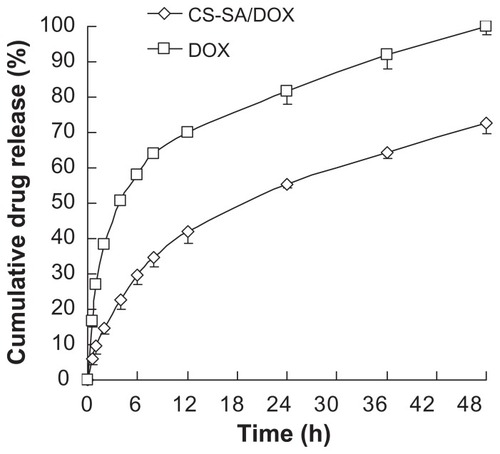
Figure 5 (A–E) In vivo images of stearic acid–grafted chitosan/DiR. Images A–D were taken within 30 minutes after injection; E is ex vivo brain at 30 minutes after injection, compared with blank brain.
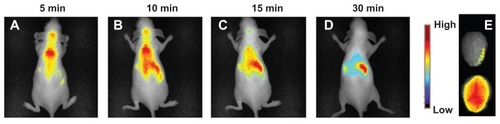
Figure 6 Brain distribution after injection of doxorubicin-loaded stearic acid–grafted chitosan at a dose of 2.5 mg/kg (equivalent of doxorubicin).
Note: Data represent the mean ± standard deviation. n = 3.
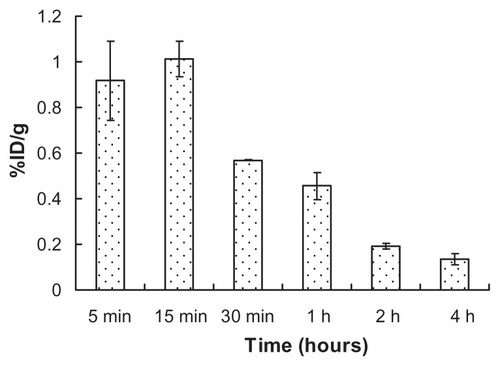
Table 2 Pharmacokinetic parameters in rat after intravenous administration of CS-SA/DOX and DOX · HCl
Figure 7 Plasma concentration versus time profiles of doxorubicin (DOX) following intravenous injection of DOX-loaded stearic acid–grafted chitosan (CS-SA/DOX) and DOX · hydrochloride (DOX HCL), both at a dose of 1 mg/kg (equivalent of DOX).
Note: Data represent the mean ± standard deviation. n = 5.
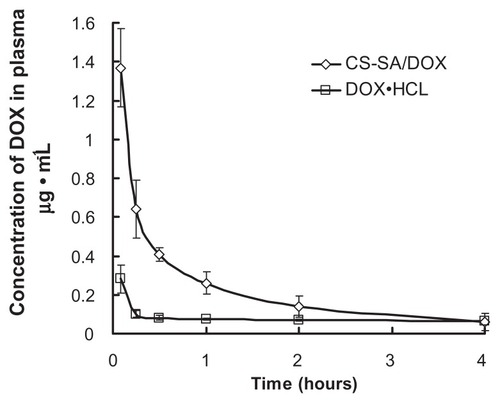
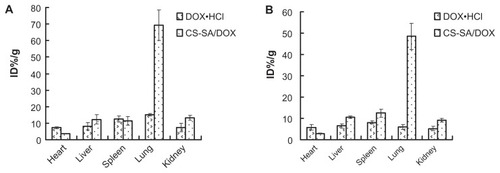
Figure 8 Tissue distribution at 0.5 and 2 hours after intravenous injection of doxorubicin-loaded stearic acid–grafted chitosan (CS-SA/DOX) and DOX · hydrochloride (DOX · HCl).
Note: Data represent the mean ± standard deviation. n = 3.