Figures & data
Table 1 MIC Values for Staphylococcus aureus (ATCC 6538) and Escherichia coli (ATCC25922) According to the CLSI M07 A9 Method
Figure 1 Schematic of experimental design.
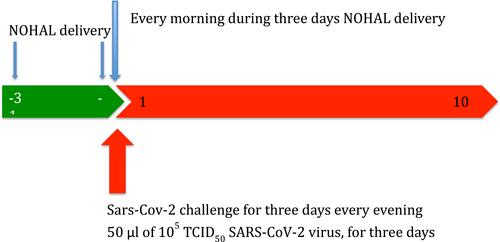
Figure 2 Zeta size and poly dispersity index of liposomes.
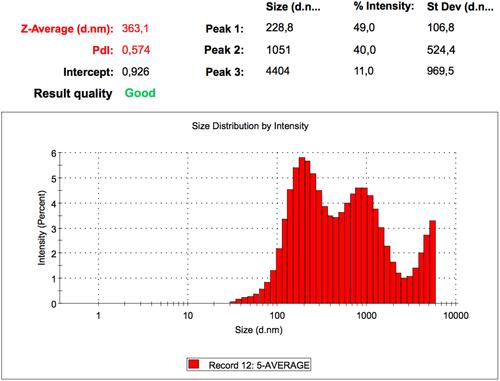
Table 2 Scoring System for Skin Reactions
Table 3 Evaluation Categories of Primary or Cumulative Irritation
Table 4 Scoring System for Oral Reactions
Table 5 Irritation Index
Table 6 Grading System for Microscopic Examinations of Oral and Nasal Tissue Reactions
Table 7 Observations Were Graded According to the Grading Scale of the Ocular Lesions
Table 8 Tests of Staphylococcus aureus (ATCC 6538), Escherichia coli (ATCC 25922), Streptococcus pneumoniae (ATCC 49619) at Different Ppm Levels and Different Durations
Table 9 ASTM F 1980 Stored at 55°C for 37 Days NOHAL Solution
Figure 3 (A) Antiviral activity in time with different concentrations of NOHAL solution. (B) Fold change of the final cDNA concentration with different concentrations of HA NOHAL solution. Statistical comparison were made using median values of duplicates. Groups with significant changes were indicated using asterisks.
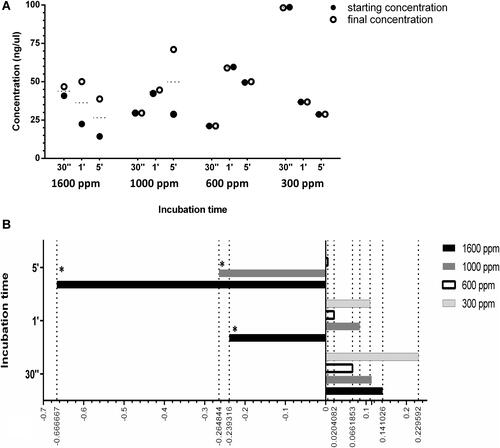
Figure 4 Continue.
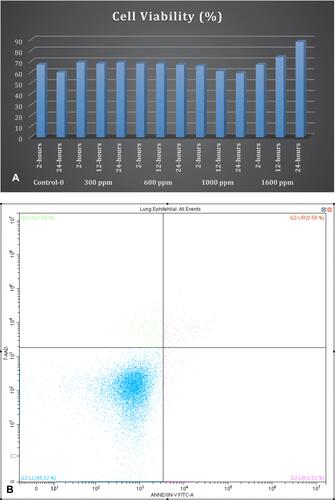
Figure 4 (A) Concentration- and time-dependent cell viability ratio changes with NOHAL treatment. (B) Flow cytometry image of 7AAD marker for viability of human primary lung epithelial cells. (C) Primary 3D cell culture of pulmonary fibroblasts and airway epithelial cells: no toxic effect is present (H&E staining).
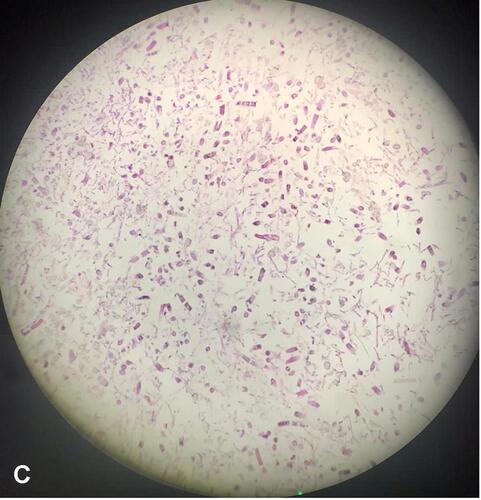
Figure 5 Cell culture studies. (A) 96% confluency is present. (B) Mesenchymal stem cells: no negative effect on cell viability. (C) Mesenchymal stem cells: positive effect of different concentrations on cell proliferation.
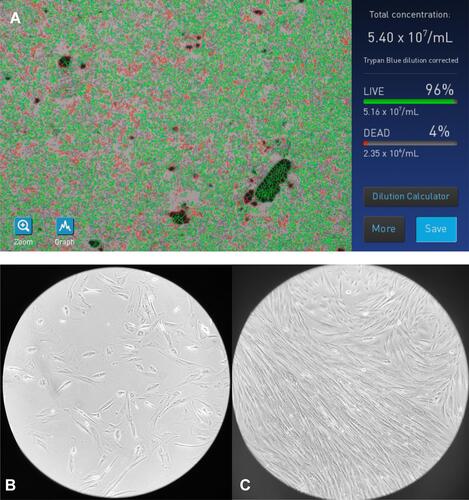
Table 10 Results of Quantitative Measurements of Cytotoxic Effects with MTT Test
Figure 6 Photomicrographs of BALB/c 3T3 (CCL-163) cell line cultures. (A) NOHAL solution, (B) negative control, (C) positive control dimethyl sulfoxide (DMSO).
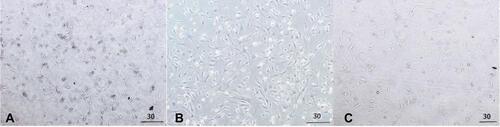
Table 11 The NC1 and NC2 Regions of the SARS-COV2 Virus Were Examined Together with Viral RNA
Figure 7 Representative photos from all groups showing (A). PBS control (PBS) group, pneumonia formation is observed in both lobes starting in the periphery and progressing towards the median. (B) NOHAL 1000ppm dose: no infection was observed in mouse lung in gross pathology. (C) NOHAL 1600ppm dose: no infection was observed in the mouse lung in gross pathology.
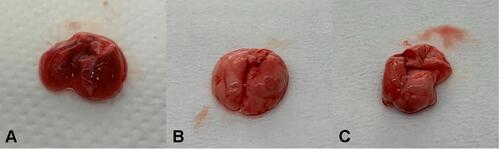
Figure 8 Representative CT values of PBS group in RT-PCR (A and B).
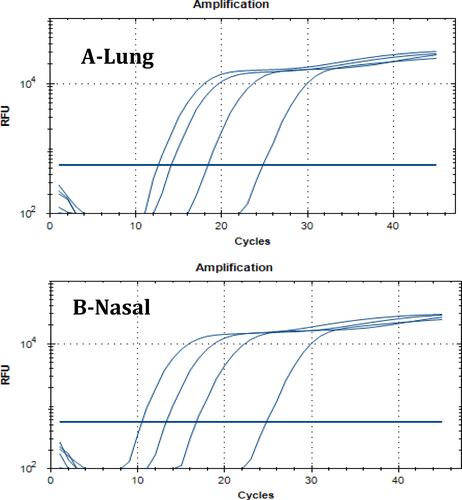
Figure 9 Representative CT values of NOHAL group in RT-PCR (A and B).
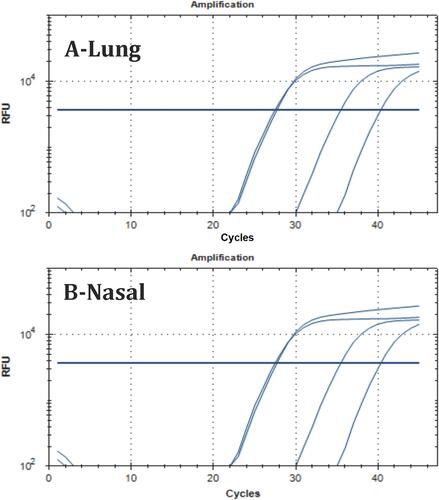
Table 12 Skin Irritation Test Scores
Table 13 Average of Skin Irritation Scores
Figure 10 Application sites and irritation appearance at 24 (A), 48 (B) hours: it is observed that there is no irritation effect according to the positive control.
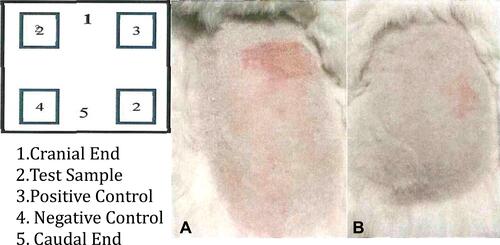
Table 14 Oral Macroscopic Irritation Score
Figure 11 Macroscopic view of inner cheeks, (A) NOHAL (B) negative control (C) positive control.
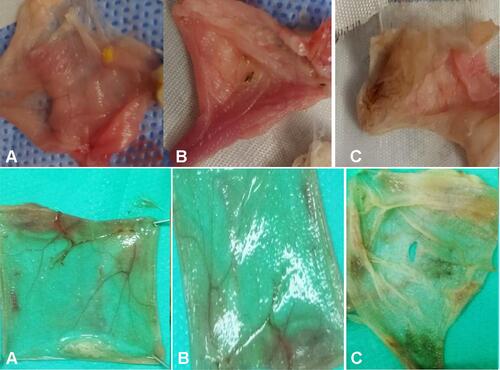
Table 15 Oral Microscopic Irritation Score
Figure 12 Photomicrographs showing inner buccal mucosa (H&E staining). (A) NOHAL solution, (B) negative control, (C) positive control.
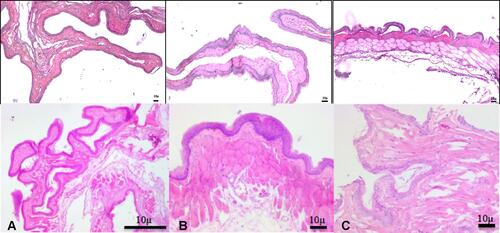
Table 16 Nasal Microscopic Irritation Score
Figure 13 Photomicrographs showing nasal turbinates and nasal mucosa (H&E staining), (A) control, (B) NOHAL solution.
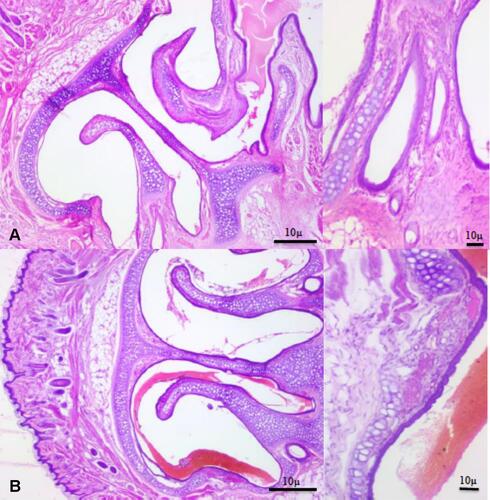
Table 17 Result of the Ocular Irritation Test
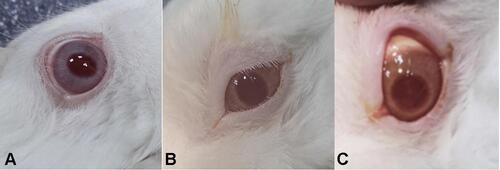
Figure 14 Photos showing ocular irritation test (A). Control (right eye), (B and C) NOHAL solution group (right eye)-fluorescein does not stain a normal cornea, no staining was seen.