Figures & data
Figure 1 Synthetic scheme for preparation of targeted PEGylated liposomes.
Abbreviations: PEG, poly(ethylene glycol); EPC, egg phosphatidylcholine; Chol, cholesterol; DSPE, distearolyphosphatidyl ethanolamine; EDC, 1-ethyl-3-(3- dimethylaminopropyl)-carbodiimide hydrochloride; NHS, N-hydroxysuccinimide; tbFGF, truncated basic fibroblast growth factor.
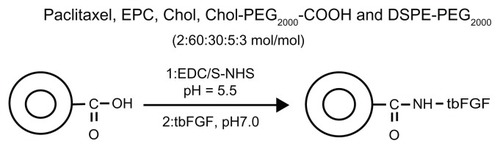
Table 1 Particle size and zeta potential (mean ± SD, n = 3) of CL-PTX and TL-PTX
Figure 2 Particle size distribution of paclitaxel-loaded conventional liposomes (A) and paclitaxel-loaded targeted PEGylated liposomes (B), and typical atomic force microscopy image of paclitaxel-loaded targeted PEGylated liposomes (C).
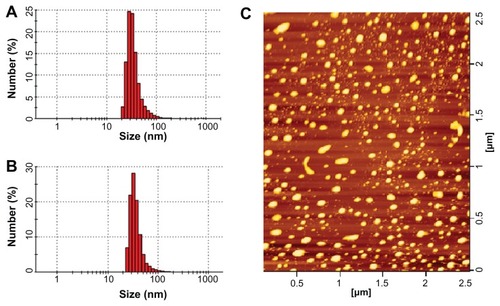
Table 2 Stability of formulated liposomes (mean ± SD, n = 3)
Figure 3 Time course of paclitaxel release from TL-PTX (▲), CL-PTX (■), and free PTX(◆) at 37°C and pH 7.0. The paclitaxel Released was separated by dialysis and quantified using high-performance liquid chromatography.
Notes: There were five mice per group per time point. Bars represent the mean ± standard deviation. Error bars correspond to 95% confidence intervals.
Abbreviations: CL-PTX, paclitaxel-loaded conventional liposomes; TL-PTX, paclitaxel-loaded targeted PEGylated liposomes; Free PTX, paclitaxel dissolved in Cremophor EL.
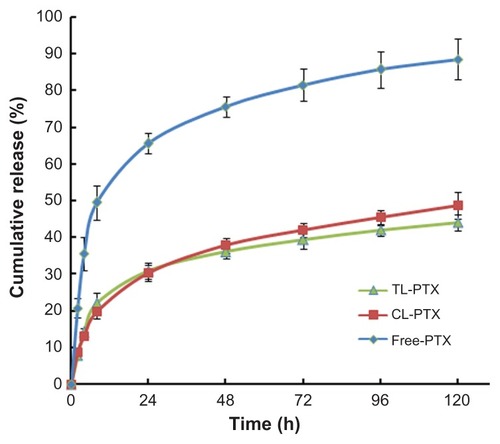
Table 3 Pharmacokinetic parameters for paclitaxel in plasma after intravenous administration of free PTX, CL-PTX, and TL-PTX (mean ± standard deviation)
Figure 4 Areas under the curve over 24 hours for paclitaxel in serum after treatment with free PTX (◆), CL-PTX (■), or TL-PTX (▲).
Notes: There were five mice per group per time point. Bars represent the mean ± standard deviation.
Abbreviations: CL-PTX, paclitaxel-loaded conventional liposomes; TL-PTX, paclitaxel-loaded targeted PEGylated liposomes; Free PTX, paclitaxel dissolved in Cremophor EL.
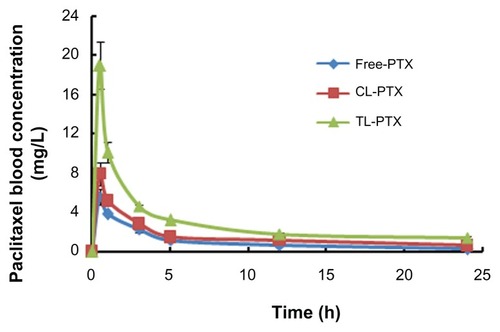
Table 4 Increase versus time of distribution of TL-PTX in the tumors compared with CL-PTX and free PTX, respectively
Figure 5 Mean paclitaxel concentration in tumor tissue at each time point after treatment with free PTX, CL-PTX, and TL-PTX. Paclitaxel was extracted from the tumors and measured by ultraperformance liquid chromatography.
Notes: There were five mice per group per time point. Bars represent the mean ± standard deviation.
Abbreviations: CL-PTX, paclitaxel-loaded conventional liposomes; TL-PTX, paclitaxel-loaded targeted PEGylated liposomes; Free PTX, paclitaxel dissolved in Cremophor EL.
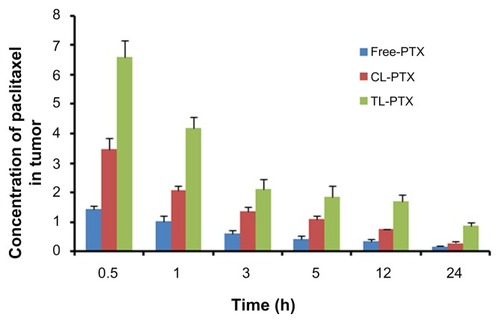
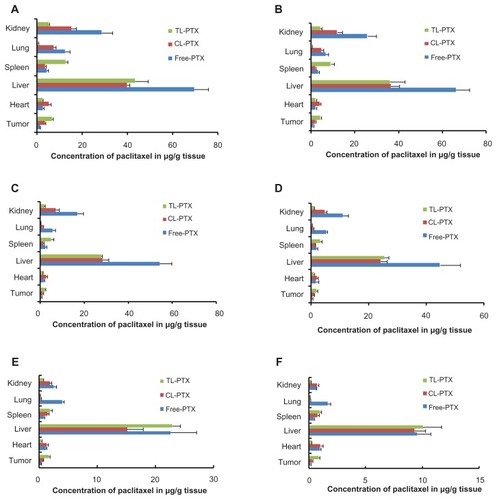
Figure 6 Mean paclitaxel concentration in tumor, lungs, heart, spleen, liver, and kidneys of mice treated with free PTX, CL-PTX, and TL-PTX. Mice were sacrificed at the indicated time points of (A) 0.5, (B) 1, (C) 3, (D) 5, (E) 12, and (F) 24 hours after administration, and paclitaxel was extracted from the tissues and measured by ultraperformance liquid chromatography.
Notes: There were five mice per group per time point. Bars represent the mean ± standard deviation.
Abbreviations: CL-PTX, paclitaxel-loaded conventional liposomes; TL-PTX, paclitaxel-loaded targeted PEGylated liposomes; Free PTX, paclitaxel dissolved in Cremophor EL.