
Figures & data
Figure 1 Procedures and characteristics of SEC for separating EVs from serum. (A) Schematic overview of the experimental workflow. (B) Concentrations of particles and proteins in the SEC fractions were determined with nanoparticle tracking analysis (gray) and BCA (red), respectively. Data shows all 24 fractions. (C) SDS-PAGE was used to determine to directly visualize the relative presence of proteins in the all collected fractions, 15 μL of each fraction was mixed with 5 μL 4-fold concentrated reducing sample buffer, boiled for 5 minutes, and loaded on a 10% gradient gel. (D) The presence of the vesicle marker CD9, CD81, and the serum contaminant protein albumin and apolipoprotein marker apoA were determined in pooled EVs concentrates of fractions 8–13 and pooled Non-EVs concentrates fractions 14–24 with Western blot. (E) Droplets of fractions 9–11 and 20 were loaded onto grids, negative stained, and evaluated with transmission electron microscopy (TEM). Examples of EV-like structures (cup-shaped) are indicated by white arrows. Scale bars are 200 nm.
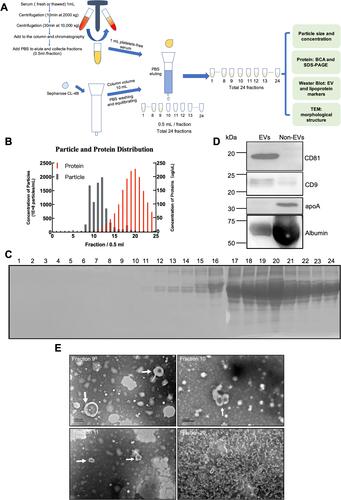
Figure 2 Systematically compare the separation efficiency of SEC, UC, and TEI. (A) Schematic overview of the experimental workflow. (B) total protein was determined by BCA (expressed as mg/mL originating serum; mean ± SD, n = 3). (C) the concentration of particles as detected by NTA (particles/mL originating serum; mean ± SD, n = 3). (D) the ratio of particle to protein for SEC, UC, and TEI. (E) size distribution of particles detected in C (representative for n = 3). The particle size at peak optimum is indicated. (F) samples were analyzed by SDS-PAGE followed by Bio-Safe Coomassie G-250. (G) the same samples were analyzed by Western blotting for the presence of the EV markers CD9, CD81, CD63, and the serum contaminant protein albumin and apolipoprotein marker apoA. The experiment shown is representative of 3 independent experiments. (F and G) SEC, TEI, and UC samples are all separated from equivalent volumes of 1mL originating serum, and the final volume is 100 μL. UCx3 samples were separated from 3mL originating serum, and the final volume is 100 μL. All samples were loaded on equal volumes for electrophoresis. (H) The whole amount of TEM images of particles collected by SEC, UC, or TEI. Examples of EV-like structures (cup-shaped) are indicated by white arrows. Scale bars are 500 nm. Data were used for comparative analysis and presented as columns with bars representing means ± SD. Marks: *p≤0.05; **p≤0.01; ***p≤0.001 and non-significant differences were indicated using ns symbol.
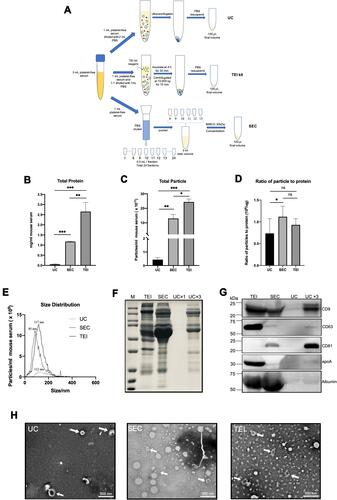
Figure 3 Comparison of two different combination methods and SEC. (A) Schematic overview of the experimental workflow. (B) total protein was determined by BCA (expressed as mg/mL originating serum; mean ± SD, n = 3). (C) the concentration of particles as detected by NTA (particles/mL originating serum; mean ± SD, n = 3). (D) the ratio of particle to protein for SEC, SEC+UC, and SEC+TEI. (E) size distribution of particles detected in C (representative for n = 3). The particle size at peak optimum is indicated. (F) samples were analyzed by SDS-PAGE followed by Bio-Safe Coomassie G-250. (G) the same samples were analyzed by Western blotting for the presence of the EV markers CD9, CD81, CD63, and the serum contaminant protein albumin and apolipoprotein marker apoA. The experiment shown is representative of 3 independent experiments. (F and G) SEC, SEC+UC, and SEC+TEI samples are all separated from equivalent volumes of 1mL originating serum, and the final volume is 100 μL. SEC+UCx3 samples were separated from 3mL originating serum, and the final volume is 100μL. All samples were loaded on equal volumes for electrophoresis. (H) The whole amount of TEM images of particles collected by SEC, SEC+UC, or SEC+TEI. Examples of EV-like structures (cup-shaped) are indicated by white arrows. Scale bars are 500 nm. Data were used for comparative analysis and presented as columns with bars representing means ± SD. Marks: *p≤0.05; **p≤0.01; ***p ≤ 0.001 and non-significant differences were indicated using ns symbol.
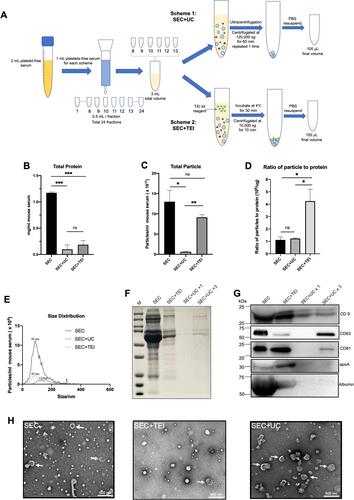
Table 1 Summarizes and Evaluates the Results of All the Above Methods