Figures & data
Figure 1 Preparation and functionalization of nanodiamonds (NDs) with lysine in the presence of a three-carbon-length linker: (A) synthesis of compound 1 [N′-(Nα,Nε-bis-Boc-lysyl),N″-(Fmoc)-diaminopropane], reagents, and solvents – Fmoc-NH(CH2)3NH2 · HCl, HATU [N,N,N′,N′-tetramethyl-O-(7-azabenzotriazol-1-yl) uronium hexafluorophosphate], diisopropylethylamine, and dimethylformamide (DMF); (B) Fmoc deprotection, reagents, and solvents – 50% (v/v) piperidine-DMF; (C) reoxidation of pristine carboxylated NDs, reagents – concentrated sulfuric acid and concentrated nitric acid, and preparation of acid chloride–functionalized NDs, reagents – thionyl chloride; (D) synthesis of Boc-protected lysine-functionalized NDs, solvent – DMF; (E) deprotection of Boc on lysine-functionalized NDs, reagents, and solvents – hydrochloric acid and dichloromethane.
![Figure 1 Preparation and functionalization of nanodiamonds (NDs) with lysine in the presence of a three-carbon-length linker: (A) synthesis of compound 1 [N′-(Nα,Nε-bis-Boc-lysyl),N″-(Fmoc)-diaminopropane], reagents, and solvents – Fmoc-NH(CH2)3NH2 · HCl, HATU [N,N,N′,N′-tetramethyl-O-(7-azabenzotriazol-1-yl) uronium hexafluorophosphate], diisopropylethylamine, and dimethylformamide (DMF); (B) Fmoc deprotection, reagents, and solvents – 50% (v/v) piperidine-DMF; (C) reoxidation of pristine carboxylated NDs, reagents – concentrated sulfuric acid and concentrated nitric acid, and preparation of acid chloride–functionalized NDs, reagents – thionyl chloride; (D) synthesis of Boc-protected lysine-functionalized NDs, solvent – DMF; (E) deprotection of Boc on lysine-functionalized NDs, reagents, and solvents – hydrochloric acid and dichloromethane.](/cms/asset/336760fc-07f7-49b2-95bb-706e4f1334e6/dijn_a_32877_f0001_c.jpg)
Figure 2 Baseline-corrected static scan Raman spectra of the pristine carboxylated nanodiamonds (pNDs), reoxidized nanodiamonds (rNDs), lysine-functionalized nanodiamonds (fNDs), and compound 1 [N′-(Nα,Nε-bis-Boc-lysyl),N″-(Fmoc)-diaminopropane] using a 514.5 nm excitation source. A total of 128 accumulations were collected for pNDs and rNDs, while the spectrum of fNDs was obtained from a single acquisition.
![Figure 2 Baseline-corrected static scan Raman spectra of the pristine carboxylated nanodiamonds (pNDs), reoxidized nanodiamonds (rNDs), lysine-functionalized nanodiamonds (fNDs), and compound 1 [N′-(Nα,Nε-bis-Boc-lysyl),N″-(Fmoc)-diaminopropane] using a 514.5 nm excitation source. A total of 128 accumulations were collected for pNDs and rNDs, while the spectrum of fNDs was obtained from a single acquisition.](/cms/asset/3924ec71-a9a0-4a1c-ad19-8fdcb4153360/dijn_a_32877_f0002_c.jpg)
Figure 3 Baseline-corrected absorbance and attenuated total reflectance: (A) infrared spectra of the pristine carboxylated nanodiamonds (pNDs), reoxidized nanodiamonds (rNDs), lysine-functionalized nanodiamonds (fNDs), and compound 1 [N′-(Nα,Nε-bis-Boc-lysyl),N″-(Fmoc)-diaminopropane]; (B) second derivatives of all spectra.
Notes: A total of 512 individual interferograms were collected and averaged for each sample. The featureless region between wave numbers of 2700 and 1900 cm−1 is not shown.
![Figure 3 Baseline-corrected absorbance and attenuated total reflectance: (A) infrared spectra of the pristine carboxylated nanodiamonds (pNDs), reoxidized nanodiamonds (rNDs), lysine-functionalized nanodiamonds (fNDs), and compound 1 [N′-(Nα,Nε-bis-Boc-lysyl),N″-(Fmoc)-diaminopropane]; (B) second derivatives of all spectra.Notes: A total of 512 individual interferograms were collected and averaged for each sample. The featureless region between wave numbers of 2700 and 1900 cm−1 is not shown.](/cms/asset/eece8553-e5ce-4ebd-b6a1-79c837e7b724/dijn_a_32877_f0003_c.jpg)
Table 1 Zeta potential measurements of nanodiamonds (NDs)
Table 2 Surface loading of nanodiamonds (NDs), as calculated from their respective thermograms
Figure 4 Thermograms of pristine carboxylated nanodiamonds (pNDs), reoxidized nanodiamonds (rNDs), and lysine-functionalized nanodiamonds (fNDs).
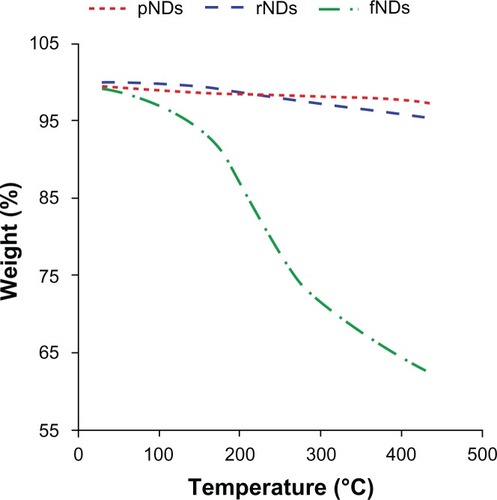
Figure 5 Dispersion of 2 mg/mL nanodiamonds (NDs) in water after 20 minutes of conventional bath sonication and 3-day incubation.
Abbreviations: pNDs, pristine carboxylated nanodiamonds; rNDs, re-oxidized nanodiamonds; fNDs, lysine-functionalized nanodiamonds.
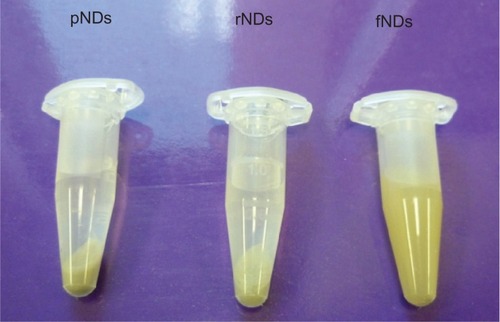
Figure 6 Size distributions of pristine carboxylated nanodiamonds (pNDs), reoxidized nanodiamonds (rNDs), and lysine-functionalized nanodiamonds (fNDs) in water, as measured by dynamic light scattering.
Note: Each curve is derived from three measurements (n ≥ 10).
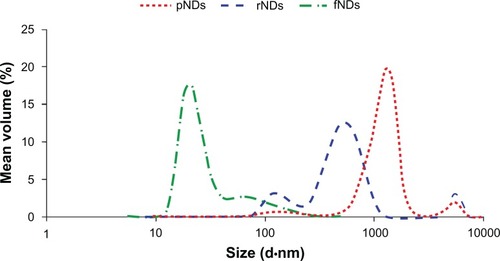
Figure 7 (A) Intermittent contact mode atomic force microscopy topographic images of nanodiamond samples and (B) line-scan profiles of the particles indicated in each image. From left to right: (i) pristine carboxylated, (ii) reoxidized, and (iii) lysine-functionalized nanodiamonds.
Note: The bar (solid white line) represents 500 nm.
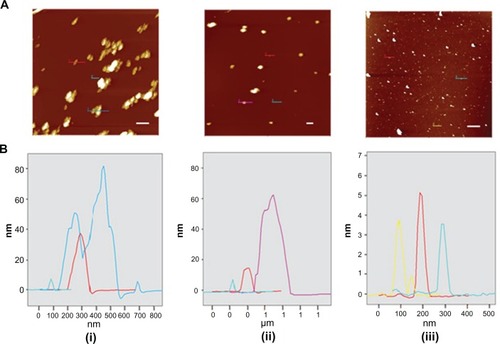
Figure 8 Results of agarose gel electrophoresis of (A) lysine-functionalized nanodiamond (fND)–plasmid DNA and (B) fND–small interfering RNA complexes (“diamoplexes”) with increasing weight ratios of fNDs to nucleic acid: 1:1 (lane 2), 5:1 (lane 3), 10:1 (lane 4), 15:1 (lane 5), 20:1 (lane 6), 25:1 (lane 7), 30:1 (lane 8), 35:1 (lane 9), 40:1 (lane 10), 45:1 (lane 11), and 50:1 (lane 12). Lane 1 consists of standard nucleic acid only, and lane 13 is empty.
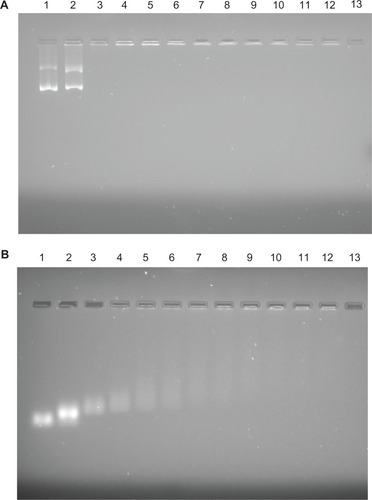
Figure 9 Size and zeta potential measurements using various weight ratios of (A) lysine-functionalized nanodiamonds and plasmid DNA (fNDs:pDNA) and (B) fNDs and small interfering RNA (fNDs:siRNA).
Notes: Each value represents mean plus or minus standard deviation of four measurements (n ≥ 10).
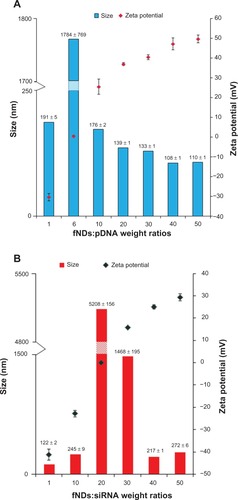
Table 3 Ratios of lysine linker residues on the nanodiamonds (NDs) per base pair of genetic material, as calculated from surface loading measurements
Figure 10 Schematic representation of the different binding behavior of plasmid DNA (pDNA) and small interfering RNA (siRNA) to positively charged lysine-functionalized nanodiamonds (fNDs).
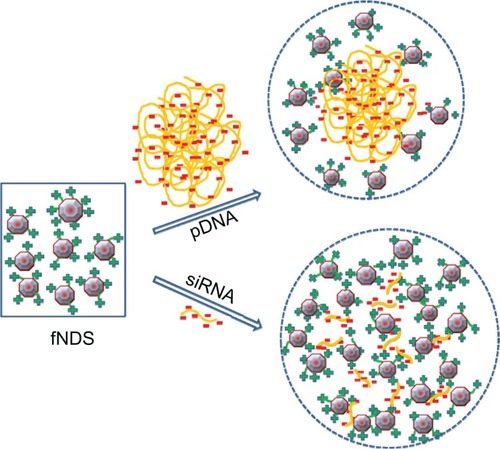
Figure S1 Proton nuclear magnetic resonance spectra of compound 1 [N′-(Nα,Nε-bis-Boc-lysyl),N″-(Fmoc)-diaminopropane] at 500 MHz.
![Figure S1 Proton nuclear magnetic resonance spectra of compound 1 [N′-(Nα,Nε-bis-Boc-lysyl),N″-(Fmoc)-diaminopropane] at 500 MHz.](/cms/asset/8093492b-f02f-4757-93dc-5eef24cd2ca0/dijn_a_32877_sf0001_b.jpg)
Figure S2 Mass spectrum of compound 1 [N′-(Nα,Nε-bis-Boc-lysyl),N″-(Fmoc)-diaminopropane].
Abbreviations: max, maximum; m/z, mass-to-charge ratio.
![Figure S2 Mass spectrum of compound 1 [N′-(Nα,Nε-bis-Boc-lysyl),N″-(Fmoc)-diaminopropane].Abbreviations: max, maximum; m/z, mass-to-charge ratio.](/cms/asset/091d8123-3ef8-4019-9bee-4ea3f65f7cfb/dijn_a_32877_sf0002_b.jpg)