Figures & data
Figure 1 (A) Transmission electron micrographs of MNPs (left) and MNCs (middle) and the diffraction pattern of MNCs (right). (B) Superconducting quantum interference spectra of MNPs, MNCs and MNC-rtPA at room temperature. (C) FT-IR spectra of free rtPA, MNCs, and MNC-rtPA at room temperature. (D) UV-Vis spectra of SPAnNa and SPAnH at room temperature. (E) ESR measurement of SPAnH.
Abbreviations: TEM, transmission electron micrograph; MNPs, magnetic nanoparticles; MNCs, magnetic nanocarriers; rtPA, recombinant tissue plasminogen activator; FT-IR, Fourier transform infrared spectroscopy; UV-Vis, ultraviolet-visible spectroscopy; SPAnNa, poly[aniline-co-sodium N-(1-one-butyric acid) aniline]; SPAnH, poly[anilineco- N-(1-one-butyric acid) aniline]; ESR, electron spin resonance.
![Figure 1 (A) Transmission electron micrographs of MNPs (left) and MNCs (middle) and the diffraction pattern of MNCs (right). (B) Superconducting quantum interference spectra of MNPs, MNCs and MNC-rtPA at room temperature. (C) FT-IR spectra of free rtPA, MNCs, and MNC-rtPA at room temperature. (D) UV-Vis spectra of SPAnNa and SPAnH at room temperature. (E) ESR measurement of SPAnH.Abbreviations: TEM, transmission electron micrograph; MNPs, magnetic nanoparticles; MNCs, magnetic nanocarriers; rtPA, recombinant tissue plasminogen activator; FT-IR, Fourier transform infrared spectroscopy; UV-Vis, ultraviolet-visible spectroscopy; SPAnNa, poly[aniline-co-sodium N-(1-one-butyric acid) aniline]; SPAnH, poly[anilineco- N-(1-one-butyric acid) aniline]; ESR, electron spin resonance.](/cms/asset/8b3dde9f-caae-4db8-b995-3005d143c9ea/dijn_a_32939_f0001_c.jpg)
Figure 2 (A) Quantification and activity of MNC-rtPA in 1 mg of MNCs versus added rtPA. Values are the means ± SD (n = 8). (B) Storage stability of free rtPA at 4°C (■), free rtPA at 25°C (●), free rtPA at 37°C (▲), and MNC-rtPA at 4°C (▼), MNC-rtPA at 25°C (◀), MNC-rtPA at 37°C (▶).
Note: Values are the means ± SD (n = 8).
Abbreviations: MNC, magnetic nanocarriers; rtPA, recombinant tissue plasminogen activator.
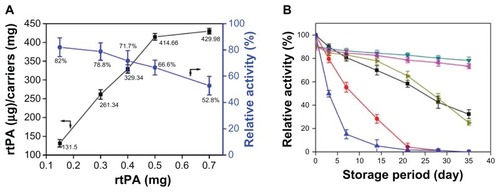
Figure 3 (A) Cytotoxicity of MNCs in HUVECs without (■) and with (●) an applied magnetic field of 800-G. (B) Fluorescence micrographs of control (top) and MNCs (bottom) in HUVECs after 1, 3, and 7 days.
Note: Values are the means ± SD (n = 8).
Abbreviations: MNC, magnetic nanocarrier; rtPA, recombinant tissue plasminogen activator.
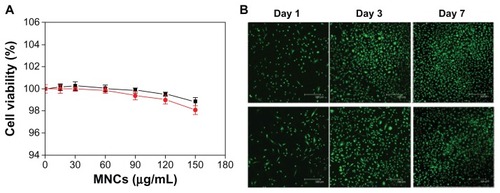
Figure 4 In vitro noncirculating thrombolysis induction. The in vitro noncirculating thrombolysis induced by (A) the control; (B) 62 μg of free rtPA; (C) 62 μg of effective rtPA in MNC-rtPA; (D) MNCs; (E) 62 μg of effective rtPA in MNC-rtPA; and (F) MNCs with an applied magnetic field of 0.3-T (left); and their statistical illustration (right), Values are the means ± SD (n = 3).
Abbreviations: rtPA, recombinant tissue plasminogen activator; MNC, magnetic nanocarrier; OD405, optical density at 405 nm; SD, standard deviation.
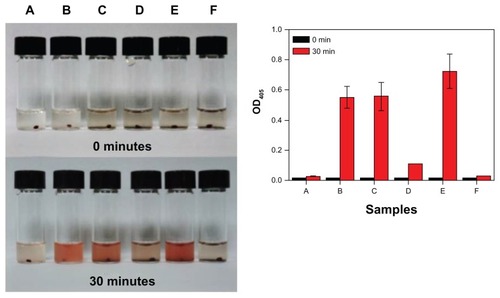
Figure 5 (A) The in vitro circulating thrombolysis induced by 250 μg of free rtPA (top) or equivalent effective amount of rtPA in MNC-rtPA (bottom) with an applied magnetic field of 0.3-T. (B) The thrombolysis times of free rtPA and MNC-rtPA.
Notes: *P < 0.001 compared with control; #P < 0.001 compared with free rtPA. Values are the means ± SD (n = 5).
Abbreviations: rtPA, recombinant tissue plasminogen activator; MNC, magnetic nanocarrier; T, Tesla; SPAnH, poly[aniline-co-N-(1-one-butyric acid) aniline]; SD, standard deviation.
![Figure 5 (A) The in vitro circulating thrombolysis induced by 250 μg of free rtPA (top) or equivalent effective amount of rtPA in MNC-rtPA (bottom) with an applied magnetic field of 0.3-T. (B) The thrombolysis times of free rtPA and MNC-rtPA.Notes: *P < 0.001 compared with control; #P < 0.001 compared with free rtPA. Values are the means ± SD (n = 5).Abbreviations: rtPA, recombinant tissue plasminogen activator; MNC, magnetic nanocarrier; T, Tesla; SPAnH, poly[aniline-co-N-(1-one-butyric acid) aniline]; SD, standard deviation.](/cms/asset/c2d55f3a-1f6f-4c55-ae6d-58da85d03c4f/dijn_a_32939_f0005_c.jpg)
Figure 6 Dynamic scintigraphy of 99mTc-MNC biodistribution with (A) and without (C) magnetic guidance. The time versus relative radioactivity counts in the hind limb with respect to the forelimb were calculated for comparison (B and D). Magnetic guidance was achieved by application of an NdFeB magnet (0.5-T) placed by the left iliac artery of the rat.
Note: The image intensity was normalized to the steady blood pool mean radioactivity counts in the forelimb region around 10 minutes post injection.
Abbreviations: MNC, magnetic nanocarrier; Lg, lung; Lv, liver; Inj, injection site; Sp, spleen; arrow heads, catheter for tracer injection.
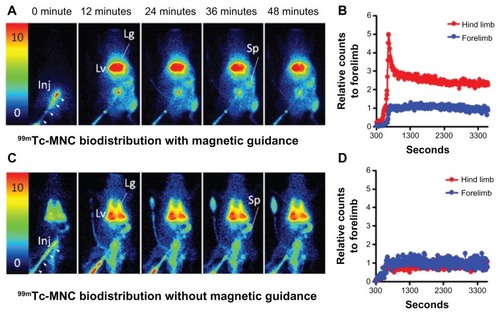
Figure 7 Representative results of the effects of MNC-rtPA on tissue perfusion in a rat embolism model. The tissue perfusion of the hind limb and cremaster area was measured with a laser Doppler perfusion imager. Five minutes after clot lodging, MNCs (1.1 mg/kg) with (B and C) or without (A) MNC-rtPA (0.2 mg/kg) were administered from the right iliac artery under magnetic guidance. Laser Doppler signals in the designated areas, as illustrated with the squares in (A), were acquired for the quantitative analysis of hind limb versus cremaster perfusion.
Abbreviations: MNC, magnetic nanocarrier; rtPA, recombinant tissue plasminogen activator.
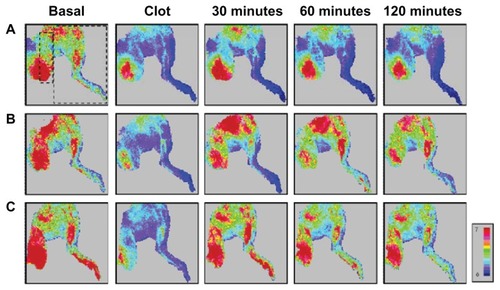
Figure 8 Thrombolytic effects of MNC-rtPA in a rat embolic model. The mean arterial pressure (A), heart rate (B), aortic blood flow (C), left iliac blood flow (D), left hind limb perfusion (E), and left cremaster perfusion (F) were measured before and after the introduction of a whole blood clot into the left iliac artery at time 0.
Notes: Vehicle (n = 8), MNCs (1.1 mg/kg; n = 9), or MNC-rtPA (0.2 mg/kg rtPA; n = 11) were administered from the right iliac artery 5 minutes after introducing the clot. Magnetic targeting was achieved by application of an external NdFeB magnet (0.5-T) placed by the left iliac artery in all groups studied. Values are presented as the mean ± SE. *P < 0.05 compared with the corresponding MNC group. †P < 0.05 compared with the corresponding vehicle group.
Abbreviations: MNC, magnetic nanocarrier; rtPA, recombinant tissue plasminogen activator; T, Tesla.
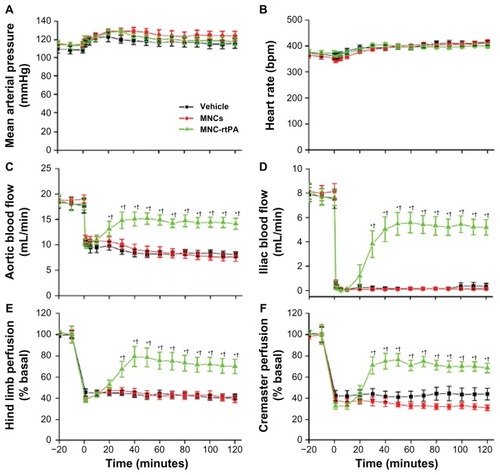
Table 1 Hematological measurements in rats at the end of the experiments in
Figure S1. The laboratory set-up for determining the efficacy of targeted thrombolysis in vitro.
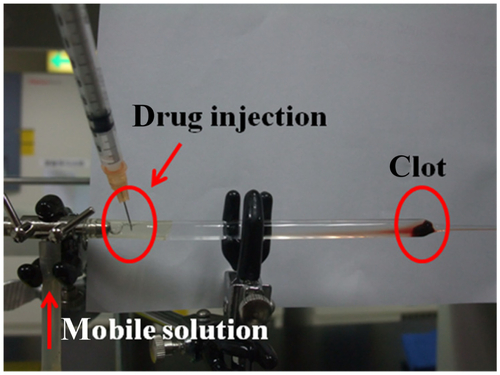
Figure S2. Lineweaver-Burk plots of (a) free rtPA and (b) MNC-rtPA.
Abbreviations: rtPA, recombinant tissue plasminogen activator; MNC, magnetic nanocarrier.
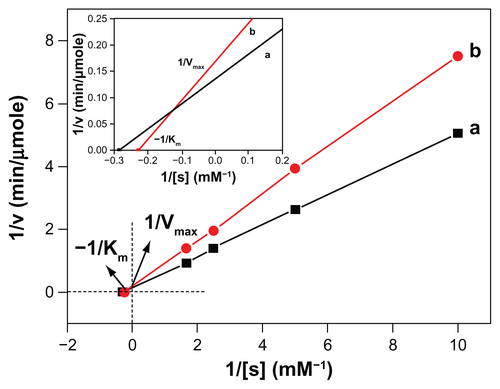
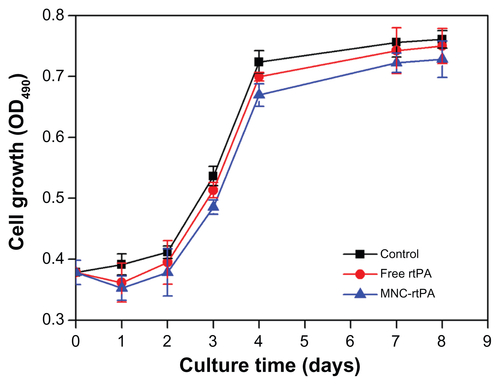
Figure S3. Cytotoxicity of free rtPA and MNC-rtPA in HUVECs.
Note: Values are the means ± SD (n = 8).
Abbreviations: rtPA, recombinant tissue plasminogen activator; MNC, magnetic nanocarrier; HUVECs, human umbilical vein endothelial cells.