Figures & data
Figure 1 Chemical structure and polymerization scheme of PSIA.
Abbreviations: DCC, N,N′-dicyclohexylcarbodiimide; DMF, N,N-dimethylformamide; NHS, N-hydroxysuccinimide; TFA, trifluoroacetic acid.
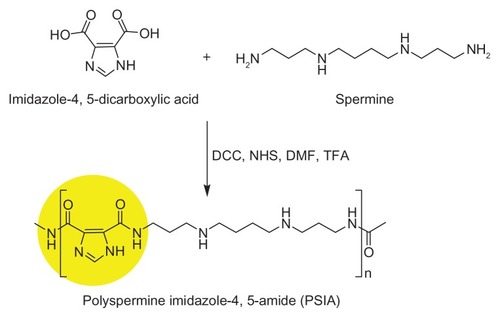
Figure 2 Chemical structure and molecular weight characterization of PSIA: (A) 1H-NMR spectrum (DMSO-d6); (B) FT-IR spectrum (within a KBr disk); (C) SEC charts (with PEG as standards and PEI 25 kDa as a calibration standard).
Abbreviations: PSIA, polyspermine imidazole-4, 5-amide; 1H-NMR, proton nuclear magnetic resonance; FT-IR, fourier transform infrared; SEC, size exclusion chromatography; PEG, polyethylene glycol; PEI, polyethyleneimine.
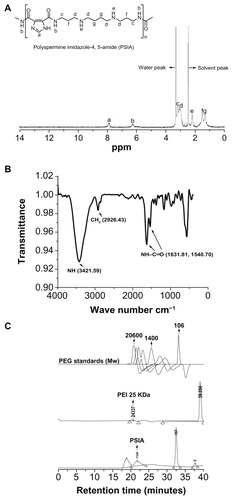
Figure 3 Physicochemical characterization of polyplexes made of PSIA and pDNA at various polymer to gene ratios (w/w) in water: (A) agarose gel electrophoresis of polyplexes; (B) TEM image of polyplexes at the polymer to gene ratio (w/w) of 20 (scale bar: 200 nm); (C) particle size distribution and zeta potential measurement of polyplexes.
Abbreviations: PSIA, polyspermine imidazole-4, 5-amide; TEM, transmission electron microscopy.
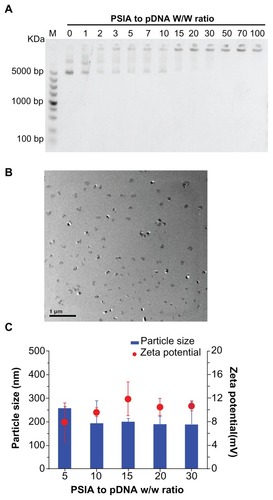
Figure 4 The degradation curves of PSIA in PBS, at pH 7.4 and pH 5.8 at 37°C (relative to the original molecular weight of PSIA).
Abbreviations: PSIA, polyspermine imidazole-4, 5-amide; PBS, phosphate buffer solution.
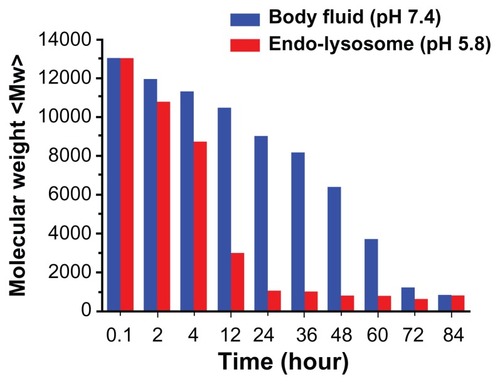
Figure 5 Cellular uptake of Rhodamine B-labeled polyplexes formed from PSIA and pDNA at the polymer to gene ratio (w/w) of 20 in COS-7 cells (A) and HepG2 cells (B) scale bar 50 μm.
Abbreviation: PSIA, polyspermine imidazole-4, 5-amide.
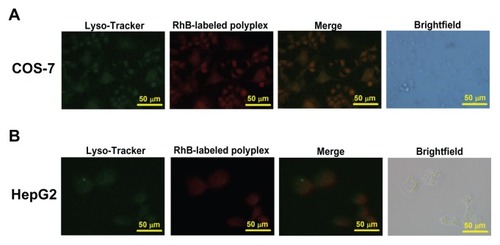
Figure 6 Luciferase activity and cytotoxicity of polyplexes formed from PSIA and pDNA in transfecting luciferase gene in COS-7 cells (A) and HepG2 cells (B) at various polymer to gene ratios (W/W).
Abbreviations: PEI, polyethylenimine; PSIA, polyspermine imidazole-4, 5-amide.
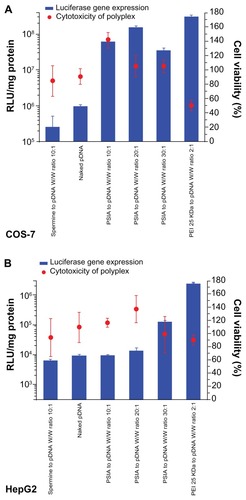
Figure 7 Expression of luciferase gene by co-transfecting pDNA and siRNA (blue: antisense; red: nonsense; black: siRNA-free) into COS-7 cells (A) and HepG2 cells (B) using PSIA; cytotoxicity of polyplexes formed from PSIA-pDNA-antisense siRNA complex (blue bar), PSIA-pDNA-nonsense siRNA complex (red bar), and PSIA-pDNA complex (black bar) at various polymer to gene ratios (W/W) in COS- 7 cells (C) and HepG2 cells (D); the value ‘0’ on the x-axis refers to naked pDNA and siRNA solution or naked pDNA solution.
Notes: *P < 0.05; **P < 0.01.
Abbreviations: PSIA, polyspermine imidazole-4, 5-amide; RLU, relative light unit.
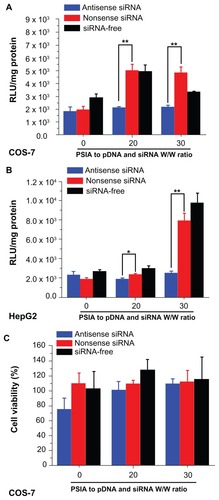
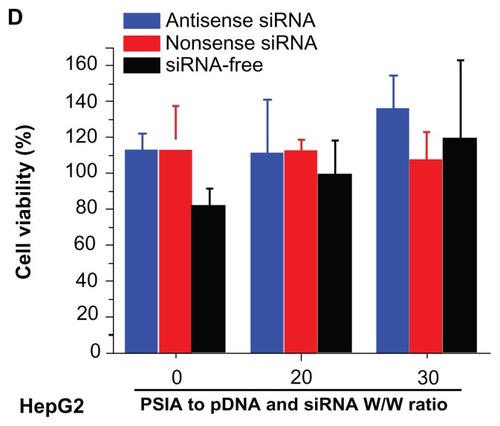
Figure 8 Viability of COS-7 cells (A) and HepG2 cells (B) treated with PSIA and PEI 25 kDa at various polymer concentrations.
Note: **P < 0.01 vs PEI 25 kDa.
Abbreviations: PSIA, polyspermine imidazole-4, 5-amide; PEI, polyethyleneimine.
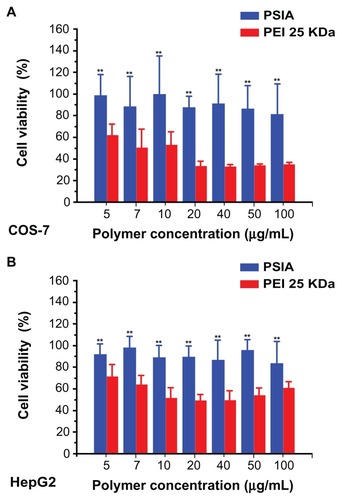
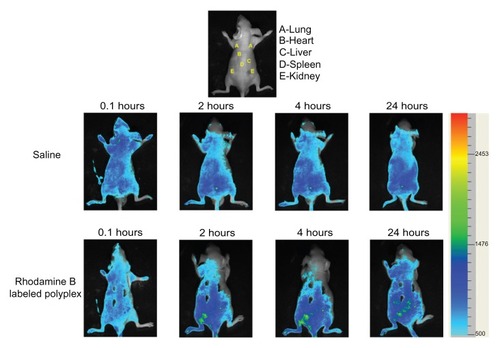
Figure 9 Biodistribution of Rhodamine B-labeled polyplexes formed from PSIA and pDNA at the polymer to gene ratio of 20 after being systemically injected in BALB/c nude-mice (saline as a control).
Abbreviation: PSIA, polyspermine imidazole-4, 5-amide.